
Updated May 2026: I’ve refreshed this guide with a clearer IMI formula, better notes on intraday momentum signals, settings, comparisons with RSI, and an updated Python walkthrough.

Introduction
The Intraday Momentum Index, usually shortened to IMI, is a momentum oscillator designed to measure buying and selling pressure inside each bar.
The easiest way to understand IMI is to compare it with RSI. RSI usually looks at close-to-close price changes. IMI looks at the difference between each bar’s open and close.
If a bar closes above its open, IMI treats that bar as an upside gain. If a bar closes below its open, IMI treats that bar as a downside loss. The indicator then compares recent gains with recent losses and converts the result into a value between 0 and 100.
That makes IMI useful for short-term traders because it focuses on what happens inside the bar, not only where the latest close sits compared with the previous close.
A high IMI reading can show strong intraday buying pressure. A low IMI reading can show strong intraday selling pressure. The mistake is to treat high as an automatic sell signal or low as an automatic buy signal. In a strong move, the indicator can stay stretched while price keeps moving.
IMI Indicator at a Glance
IMI has a simple idea behind it.
Up bars are bars where the close is above the open.
Down bars are bars where the close is below the open.
On up bars, IMI counts the open-to-close gain.
On down bars, IMI counts the open-to-close loss.
The indicator then compares the total recent gains with the total recent gains plus losses.
A reading near 50 suggests a more balanced mix of upside and downside open-to-close movement. A reading near the upper end of the range suggests stronger upside pressure. A reading near the lower end suggests stronger downside pressure.
For me, the cleanest reading is that IMI shows whether recent candles are closing with more buying pressure or more selling pressure inside the chosen lookback window.
Why Tushar Chande Created the IMI
The Intraday Momentum Index was developed by Tushar Chande, a technical analyst whose work also includes the Aroon indicator.
IMI takes the familiar oscillator logic of RSI and applies it to open-to-close movement inside each bar. That makes it more focused on intraday candle behaviour than a standard close-to-close momentum reading.
This is why IMI is often described as combining RSI-style calculation with candlestick-style information. It does not read candlestick patterns by name. It simply asks whether recent bars have been closing above or below their opens, and by how much.
That can be useful for day traders and short-term traders, but it still needs context. Strong open-to-close buying pressure may confirm a bullish move, or it may warn that price is becoming stretched. Strong open-to-close selling pressure may confirm downside momentum, or it may warn of oversold conditions in a range.
Intraday Momentum Index Formula
The Intraday Momentum Index formula is similar in spirit to RSI, but it measures a different kind of movement.
Instead of comparing today’s close with the previous close, IMI compares each bar’s close with that same bar’s open. If the bar closes above its open, the difference is counted as a gain. If the bar closes below its open, the difference is counted as a loss.
Those gains and losses are then added over the lookback period and converted into a value between 0 and 100.
Formula Key
| Symbol | Meaning |
|---|---|
t | current bar |
n | lookback period, often 14 bars |
Oₜ | open at the current bar |
Cₜ | close at the current bar |
Gₜ | gain on the current bar |
Lₜ | loss on the current bar |
ΣG | sum of gains over the lookback period |
ΣL | sum of losses over the lookback period |
IMIₜ | Intraday Momentum Index value at the current bar |
Calculate the gain on up bars
An up bar is a bar where the close is above the open. On those bars, the gain is close minus open. If the bar does not close above the open, the gain is zero.
G_t =
\begin{cases}
C_t - O_t, & \text{if } C_t > O_t \\
0, & \text{otherwise}
\end{cases}
Gain equals close minus open when the bar closes higher than it opened. Otherwise, gain is zero.
Calculate the loss on down bars
A down bar is a bar where the close is below the open. On those bars, the loss is open minus close. If the bar does not close below the open, the loss is zero.
L_t =
\begin{cases}
O_t - C_t, & \text{if } O_t > C_t \\
0, & \text{otherwise}
\end{cases}
Loss equals open minus close when the bar closes lower than it opened. Otherwise, loss is zero.
Sum the gains and losses
The gains and losses are then added over the chosen lookback period. A 14-period IMI on a 15-minute chart uses the last 14 fifteen-minute bars. A 14-period IMI on a daily chart uses the last 14 daily bars.
\sum G_t = \sum_{i=0}^{n-1} G_{t-i}\sum L_t = \sum_{i=0}^{n-1} L_{t-i}The gain sum is the total of recent up-bar gains. The loss sum is the total of recent down-bar losses over the same lookback window.
Calculate IMI
IMI_t = 100 \times \frac{\sum G_t}{\sum G_t + \sum L_t}IMI equals the sum of gains divided by the sum of gains plus losses, multiplied by 100.
What the IMI value means
Because the formula is scaled from 0 to 100, IMI readings are easy to compare.
A reading near 50 suggests the recent open-to-close gains and losses are more balanced.
A high reading means recent bars have been closing strongly above their opens.
A low reading means recent bars have been closing strongly below their opens.
The usual overbought and oversold zones are often set around 70 and 30, or 80 and 20 for stricter signals. Those levels are reference areas, not automatic trade instructions.
The main detail to remember is that IMI is based on open-to-close pressure inside each bar. A stock can close higher than the previous day but still have weak IMI if it keeps fading from its open. Likewise, a market can have strong IMI if recent bars keep closing near their highs relative to their opens.
How to Interpret Intraday Momentum Index Signals
IMI readings run from 0 to 100.
A reading near 50 suggests recent open-to-close gains and losses are fairly balanced. A high reading means recent bars have been closing strongly above their opens. A low reading means recent bars have been closing strongly below their opens.
The usual mistake is to treat high IMI as an automatic sell signal and low IMI as an automatic buy signal. That may work occasionally in a range, but it can be dangerous in a strong trend.
| IMI reading | Possible interpretation | Main caution |
|---|---|---|
| Around 50 | Open-to-close pressure is balanced | Direction may be unclear |
| Above 70 | Stronger upside pressure or overbought stretch | In an uptrend, this can be continuation |
| Above 80 | More extreme upside pressure | Extreme does not mean immediate reversal |
| Below 30 | Stronger downside pressure or oversold stretch | In a downtrend, this can be continuation |
| Below 20 | More extreme downside pressure | Extreme can become more extreme |
| Crossing back through 50 | Momentum balance is shifting | Choppy markets can create repeated crosses |
The trend context matters. If price is breaking higher and IMI is rising above 70, that may confirm strong buying pressure. If price is range-bound and IMI spikes above 80 before rolling over, the same reading may warn that the move is stretched.
The downside works the same way. If price is breaking lower and IMI falls below 30, the reading may confirm selling pressure. If price is stuck in a range and IMI drops below 20 before turning up, it may warn that the downside push is running out of force.
I would read IMI as a pressure gauge. It tells you whether recent candles have been closing strongly relative to their opens. It does not know where support or resistance sits, whether news is about to hit, or whether the next candle offers a clean entry.
| Setup type | What the trader looks for | Confirmation to watch |
|---|---|---|
| Bullish momentum continuation | IMI rises above 70 while price breaks higher | Breakout hold, strong closes, rising volume |
| Bearish momentum continuation | IMI falls below 30 while price breaks lower | Breakdown hold, weak bounces, clear support break |
| Bullish mean reversion | IMI falls below 20 or 30, then turns back up | Failed breakdown, support hold, higher low |
| Bearish mean reversion | IMI rises above 70 or 80, then turns back down | Failed breakout, resistance hold, lower high |
| Range filter | IMI swings between high and low zones while price stays boxed in | Avoid treating every signal as a trend start |
The cleanest IMI signals usually happen when the indicator reading agrees with the chart. A high IMI reading during a clean breakout is different from a high IMI reading into resistance. A low IMI reading during a breakdown is different from a low IMI reading at support.
IMI Settings and Overbought/Oversold Levels
The common IMI setting is 14 periods. That means the indicator compares open-to-close gains and losses over the last 14 bars.
The word period simply means the chart bar being used. On a 15-minute chart, 14 periods means 14 fifteen-minute candles. On a five-minute chart, it means 14 five-minute candles. On a daily chart, it means 14 daily candles.
The lookback period controls how quickly IMI responds. A shorter setting reacts faster, but it also creates more noise. A longer setting reacts more slowly, but it can smooth out some of the smaller swings.
| IMI setting | Behaviour | Possible use | Main trade-off |
|---|---|---|---|
| Shorter than 14 | Faster and more sensitive | Scalping, short intraday swings, early warnings | More false signals |
| 14 periods | Common baseline | General day-trading and comparison across platforms | May lag very fast turns |
| Longer than 14 | Slower and smoother | Filtering noise, broader intraday swings | Later signals |
| 70 / 30 levels | Common overbought and oversold zones | Standard alerting and visual reference | More frequent signals |
| 80 / 20 levels | Stricter extreme zones | Filtering for stronger stretches | Fewer but later signals |
The overbought and oversold levels are not fixed laws. Many traders use 70 and 30, similar to RSI. Some prefer 80 and 20 to focus on more extreme open-to-close pressure.
Changing those levels changes the type of signal you see. A 70/30 setup gives more alerts. An 80/20 setup waits for stronger pressure before flagging a possible extreme.
The key is to match the settings to the role of the indicator. If IMI is being used as a momentum confirmation tool, a high reading may support a trend-following setup. If it is being used as a mean-reversion warning, the trader may wait for the reading to stretch and then turn back.
| What you see | Possible issue | What to test |
|---|---|---|
| IMI keeps crossing 50 | Market may be choppy or setting may be too short | Longer lookback or stronger price filter |
| IMI rarely reaches 70 or 30 | Levels may be too strict for the market | Compare 70/30 with 80/20 |
| IMI stays above 70 | Strong upside pressure may be in place | Avoid automatic short signals |
| IMI stays below 30 | Strong downside pressure may be in place | Avoid automatic long signals |
| Signals arrive too late | Lookback may be too long | Compare with a shorter baseline |
I would start with a common baseline, such as 14 periods with 70 and 30 reference levels, then test changes deliberately. The setting should be written down and reviewed across more than one chart, rather than changed after the fact to make the last few signals look better.
Pros and Cons of the IMI Indicator
The Intraday Momentum Index is useful because it focuses on open-to-close pressure inside each bar. That gives it a different feel from indicators that only compare one close with the next close.
This can make IMI useful for short-term traders who want to know whether recent candles have been closing strongly above or below their opens. The weakness is that open-to-close pressure can change quickly, especially on noisy intraday charts.
| Strength | Why it helps |
|---|---|
| Focuses on open-to-close pressure | Shows whether recent candles are closing strongly or weakly inside the bar |
| RSI-like scale | The 0 to 100 range is easy to read and compare |
| Useful for short-term momentum | Can help day traders judge buying or selling pressure |
| Works with candlestick context | IMI pairs naturally with candles, levels and failed-break signals |
| Settings are simple | Lookback period and overbought/oversold levels are easy to test |
The limitations mostly come from treating IMI as a signal generator rather than a pressure gauge.
A high IMI reading does not automatically mean price should fall. It may simply show that buyers are in control. A low IMI reading does not automatically mean price should bounce. It may show that sellers are still pressing the market lower.
IMI can also be jumpy on short timeframes. A few strong candles can push the reading toward an extreme, but that does not mean the next candle has to reverse.
| Limitation | What can go wrong |
|---|---|
| Can give false extremes | High or low readings can continue in strong trends |
| Sensitive to noisy candles | Short intraday periods can create rapid swings |
| No trend direction by itself | IMI needs price structure to show whether pressure is useful |
| No risk level | It does not provide a stop-loss, target or position size |
| Can be confused with RSI | IMI uses open-to-close movement, not close-to-close movement |
Used well, IMI can help show whether recent bars are closing with stronger buying or selling pressure. Used badly, it becomes another oscillator that tempts traders to fade every stretched reading without checking the chart.
Coding the Intraday Momentum Index with Python
Now we can calculate the Intraday Momentum Index in Python and plot it under a candlestick chart.
The important detail is that IMI uses each bar’s open and close. If the bar closes above its open, the difference is counted as a gain. If the bar closes below its open, the difference is counted as a loss.
The example below downloads recent intraday price data, calculates a 14-period IMI, then plots price, volume and IMI in separate panels. I assume you have Python already installed and are using VSCode, which can be downloaded from Microsoft for no cost.
Step 1: Install the Python libraries
python -m pip install pandas yfinance numpy matplotlib mplfinanceIf your Windows setup uses the py launcher, this version may work better:
py -m pip install pandas yfinance numpy matplotlib mplfinancePandas handles the data table, yfinance downloads the price data, NumPy helps with the calculations, matplotlib builds the chart, and mplfinance provides the candlestick plotting function.
Step 2: Create the file and import the libraries
Save a new file as imi_indicator.py, then paste the following imports at the top.
import numpy as np
import pandas as pd
import yfinance as yf
import matplotlib.pyplot as plt
from mplfinance.original_flavor import candlestick_ohlcStep 3: Add the chart settings
ticker = "PLTR"
period = "60d"
interval = "60m"

imi_period = 14This example uses Palantir with 60-minute candles and a 14-period IMI. You can reuse the script with another ticker or interval by changing these settings.
Step 4: Download the intraday price data
data = yf.download(
    ticker,
    period=period,
    interval=interval,
    auto_adjust=True,
    progress=False,
    multi_level_index=False
)

if isinstance(data.columns, pd.MultiIndex):
    data.columns = data.columns.get_level_values(0)

data.index = pd.DatetimeIndex(data.index)
data = data.dropna(subset=["Open", "High", "Low", "Close", "Volume"])

if data.empty:
raise ValueError("No price data downloaded. Check the ticker, period and interval.")This uses recent intraday data rather than a long historical daily range. That makes the chart more relevant to the Intraday Momentum Index.
Step 5: Define the IMI calculation
def calculate_imi(price_data, period=14):
    df = price_data.copy()

    gains = np.where(
        df["Close"] > df["Open"],
        df["Close"] - df["Open"],
        0.0
    )

    losses = np.where(
        df["Open"] > df["Close"],
        df["Open"] - df["Close"],
        0.0
    )

    df["Gain"] = gains
    df["Loss"] = losses

    sum_gains = df["Gain"].rolling(window=period).sum()
    sum_losses = df["Loss"].rolling(window=period).sum()

    denominator = sum_gains + sum_losses

    df["IMI"] = np.where(
        denominator != 0,
        100 * sum_gains / denominator,
        np.nan
    )

return dfThe gains and losses are based on open-to-close movement inside each candle. This is the part that makes IMI different from a standard close-to-close momentum indicator.
Step 6: Add the IMI column
data = calculate_imi(data, imi_period)

plot_data = data.dropna(subset=["IMI"]).copy()

if plot_data.empty:
raise ValueError("Not enough valid data to calculate IMI.")The first rows are removed because IMI needs enough bars to calculate the rolling gain and loss sums.
Step 7: Prepare the chart data
plot_data["Bar"] = np.arange(len(plot_data))

ohlc = plot_data[["Bar", "Open", "High", "Low", "Close"]].values

volume_colors = np.where(
    plot_data["Close"] >= plot_data["Open"],
    "green",
    "red"
)This prepares the candlestick and volume data for the chart.
Step 8: Create the price, volume and IMI panels
fig, (ax_price, ax_volume, ax_imi) = plt.subplots(
    3,
    1,
    figsize=(12, 7),
    sharex=True,
    gridspec_kw={
        "height_ratios": [4, 1, 1.4],
        "hspace": 0.0
    }
)

fig.suptitle(
    f"{ticker} with {imi_period}-Period Intraday Momentum Index",
    fontsize=12,
    fontweight="bold"
)

candlestick_ohlc(
    ax_price,
    ohlc,
    width=0.6,
    colorup="green",
    colordown="red",
    alpha=0.85
)

ax_price.set_ylabel("Price")
ax_price.grid(True, alpha=0.25)

ax_volume.bar(
    plot_data["Bar"],
    plot_data["Volume"],
    color=volume_colors,
    width=0.6,
    alpha=0.55
)

ax_volume.set_ylabel("Volume")
ax_volume.grid(True, alpha=0.25)

ax_imi.plot(
    plot_data["Bar"],
    plot_data["IMI"],
    label="IMI",
    color="purple",
    linewidth=1.2
)

ax_imi.axhline(50, color="black", linestyle="--", linewidth=1.0, alpha=0.8)
ax_imi.axhline(70, color="gray", linestyle="--", linewidth=1.0, alpha=0.8)
ax_imi.axhline(30, color="gray", linestyle="--", linewidth=1.0, alpha=0.8)
ax_imi.axhline(80, color="red", linestyle=":", linewidth=1.0, alpha=0.8)
ax_imi.axhline(20, color="green", linestyle=":", linewidth=1.0, alpha=0.8)

ax_imi.text(
    1.002, 80, "80",
    transform=ax_imi.get_yaxis_transform(),
    va="center",
    fontsize=8,
    color="red"
)

ax_imi.text(
    1.002, 70, "70",
    transform=ax_imi.get_yaxis_transform(),
    va="center",
    fontsize=8,
    color="gray"
)

ax_imi.text(
    1.002, 50, "50",
    transform=ax_imi.get_yaxis_transform(),
    va="center",
    fontsize=8,
    color="black"
)

ax_imi.text(
    1.002, 30, "30",
    transform=ax_imi.get_yaxis_transform(),
    va="center",
    fontsize=8,
    color="gray"
)

ax_imi.text(
    1.002, 20, "20",
    transform=ax_imi.get_yaxis_transform(),
    va="center",
    fontsize=8,
    color="green"
)

ax_imi.set_ylabel("IMI")
ax_imi.set_ylim(0, 100)
ax_imi.legend(loc="upper left", fontsize=8)
ax_imi.grid(True, alpha=0.25)The IMI panel includes the 50 midline, common 70 and 30 reference levels, and stricter 80 and 20 extreme zones. The legend only lists the IMI line, while the horizontal levels are labelled directly on the right.
Step 9: Add date labels, save and show the chart
tick_count = 9
tick_positions = np.linspace(0, len(plot_data) - 1, tick_count, dtype=int)
tick_labels = plot_data.index[tick_positions].strftime("%Y-%m-%d %H:%M")

ax_imi.set_xticks(tick_positions)
ax_imi.set_xticklabels(tick_labels, rotation=45, ha="right")

plt.setp(ax_price.get_xticklabels(), visible=False)
plt.setp(ax_volume.get_xticklabels(), visible=False)

fig.subplots_adjust(
    top=0.90,
    bottom=0.18,
    left=0.08,
    right=0.94,
    hspace=0.0
)

output_file = "imi_python_chart.png"
fig.savefig(output_file, dpi=150, bbox_inches="tight")

print(f"Saved chart as {output_file}")

plt.show()The script saves the chart as imi_python_chart.png and opens the chart window.
Step 10: Run the script
Run the file from VS Code, or use this command in the terminal:
python imi_indicator.pyIf your Windows setup uses the py launcher, use:
py imi_indicator.pyYou should get a three-panel intraday chart with candlesticks, volume and IMI. The IMI panel shows whether recent candles have been closing with stronger buying or selling pressure. If all went well it should look like mine shown below:
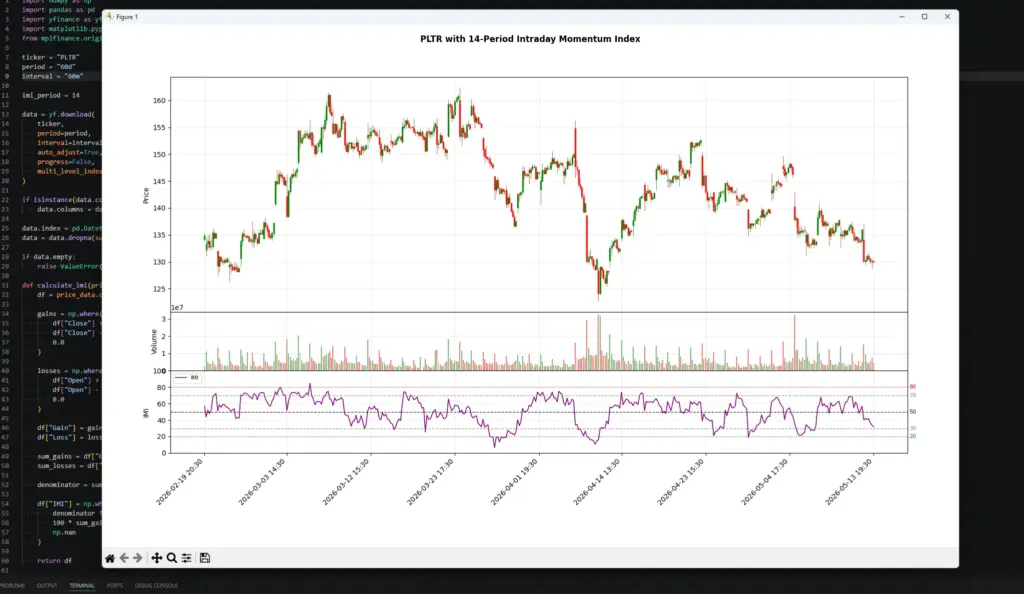
The 60-minute version makes the IMI easier to read than a very short intraday chart for this example. On the left side, price rallies strongly and IMI spends time above 70, which looks more like buying pressure than an automatic sell signal. Later, the sharp mid-April selloff pushes IMI down toward the lower part of the range while price breaks lower, so the low reading is confirming selling pressure rather than giving a clean buy signal.
By the right side of the chart, price is drifting lower and IMI has fallen back under the midline. That does not prove a new downtrend by itself, but it does show that recent candles are no longer closing with the same upside pressure. The useful question is whether price structure confirms that shift, rather than whether IMI has simply touched one reference level.
IMI vs RSI, Stochastic, MACD and ADX
The Intraday Momentum Index is easiest to understand when compared with other momentum and trend indicators.
IMI is closest to RSI because both are bounded oscillators that run from 0 to 100. The difference is the price movement being measured. RSI usually compares one close with the previous close. IMI compares each bar’s close with that same bar’s open.
That makes IMI more focused on open-to-close pressure inside the candle. It can be useful for intraday traders, but it does not replace every other momentum or trend tool.
| Indicator | Main job | How it differs from IMI | Useful pairing idea |
|---|---|---|---|
| RSI | Measures close-to-close momentum | RSI compares closes; IMI compares each bar’s open and close | Use RSI for broader momentum and IMI for candle-level pressure |
| Stochastic Oscillator | Shows where price closes within a recent high-low range | Stochastic is range-position based; IMI is open-to-close based | Compare price position with intraday candle pressure |
| MACD | Tracks moving-average momentum | MACD is trend/momentum based; IMI is bounded and candle-pressure based | MACD can define trend direction while IMI checks short-term pressure |
| ADX | Measures trend strength | ADX is not directional by itself; IMI is directional within a 0–100 oscillator | ADX can filter trend conditions before reading IMI extremes |
| Candlestick patterns | Show individual candle behaviour | IMI converts recent candle pressure into an oscillator | Use candles to confirm whether IMI pressure is being rejected or extended |
The comparison with RSI is the most important one. If a market keeps closing above its opens, IMI can rise even if close-to-close momentum is less clear. If candles keep fading from their opens, IMI can weaken even when the broader chart has not fully turned.
That can make IMI useful for intraday work, but it can also make it noisy. A few strong candles can push the indicator quickly toward an extreme. That is why I would not use it without price structure.
MACD and ADX answer different questions. MACD can help judge broader directional momentum. ADX can help judge whether the market is trending strongly enough for trend-following ideas. IMI then adds a shorter-term view of whether candles are closing with buying or selling pressure.
The cleaner approach is to give each tool a job. IMI should not be asked to define trend, entry, stop placement and trade size all by itself.
Frequently Asked Questions about the Intraday Momentum Index
Q: What is the Intraday Momentum Index?
The Intraday Momentum Index, or IMI, is a momentum oscillator that compares each bar’s close with its own open. It measures recent open-to-close buying and selling pressure.
Q: How is IMI different from RSI?
RSI usually compares one close with the previous close. IMI compares each bar’s close with that same bar’s open. That makes IMI more focused on candle-level open-to-close pressure.
Q: How is IMI calculated?
IMI adds the gains from bars that close above their opens, then divides that total by the sum of recent gains and losses. The result is multiplied by 100, giving a reading between 0 and 100.
Q: What is a common IMI setting?
A common setting is 14 periods. On a 60-minute chart, that means the last 14 hourly candles. On a 15-minute chart, it means the last 14 fifteen-minute candles.
Q: What does IMI above 70 mean?
IMI above 70 means recent bars have been closing strongly above their opens. In a range, that can warn of overbought conditions. In a trend, it may confirm buying pressure.
Q: What does IMI below 30 mean?
IMI below 30 means recent bars have been closing weakly relative to their opens. In a range, that can warn of oversold conditions. In a downtrend, it may confirm selling pressure.
Q: Is IMI a buy and sell signal?
Not by itself. IMI can support a bullish or bearish view, but price structure, support and resistance, trend context and risk control still matter.
Q: Can IMI be used for day trading?
Yes. IMI was designed for short-term momentum analysis, so it fits intraday charts well. The risk is that short timeframes can be noisy, so IMI should be used as a pressure gauge rather than a mechanical trigger.
Q: Is IMI better than RSI?
Not better, just different. RSI is usually better for broader close-to-close momentum. IMI is more focused on whether recent candles are closing above or below their opens.
Final Thoughts
The Intraday Momentum Index is useful because it looks inside the candle.
Instead of asking only whether the latest close is above or below the previous close, IMI asks whether recent bars have been closing above or below their own opens. That gives traders a different view of short-term buying and selling pressure.
The main trap is reading it too mechanically. A high IMI reading does not automatically mean sell. A low IMI reading does not automatically mean buy. In a strong move, those readings can show continuation rather than reversal.
I would use IMI as a context tool for intraday momentum. It can help show when candles are closing with stronger buying pressure, when selling pressure is building, or when momentum is becoming more balanced. The trade still needs price structure, a clean risk level and awareness of the broader market.
Further Reading
Related AlphaSquawk guides:
RSI, for the close-to-close oscillator most often compared with IMI.
Stochastic Oscillator, for another bounded oscillator used to judge short-term price position.
MACD, for moving-average momentum and trend-following signals.
ADX, for judging whether the market has enough trend strength to support directional trades.
Candlestick Patterns, for reading the candle behaviour that IMI converts into an oscillator.
Aroon Indicator, for another Tushar Chande indicator focused on trend timing.
Books and references:
“The New Technical Trader”, Tushar Chande and Stanley Kroll.
“Beyond Technical Analysis”, Tushar Chande.
“Technical Analysis Explained: The Successful Investor’s Guide to Spotting Investment Trends and Turning Points” by Martin J. Pring. This book is a comprehensive guide to technical analysis and covers a wide range of topics, including various technical indicators.
“Evidence-Based Technical Analysis: Applying the Scientific Method and Statistical Inference to Trading Signals” by David Aronson. This book applies rigorous statistical techniques to evaluate the performance of various technical indicators and trading strategies.
“Quantitative Trading: How to Build Your Own Algorithmic Trading Business” by Dr. Ernest Chan. This book provides insights into the world of algorithmic trading and covers various aspects of coding trading strategies.
“A Complete Guide to the Futures Market: Technical Analysis, Trading Systems, Fundamental Analysis, Options, Spreads, and Trading Principles” by Jack D. Schwager and Mark Etzkorn. This book provides a comprehensive overview of futures trading, including technical analysis and trading systems.
“Advances in Financial Machine Learning” by Marcos Lopez de Prado. This book covers various aspects of machine learning in finance, including the use of technical indicators in machine learning models.
“The Evaluation and Optimization of Trading Strategies” by Robert Pardo. This book provides a step-by-step process for developing and validating trading strategies, including the use of technical indicators.
“Technical Analysis of the Financial Markets: A Comprehensive Guide to Trading Methods and Applications” by John J. Murphy. This book is a classic in the field of technical analysis and covers a wide range of topics, including various technical indicators.


