
Updated May 2026: I’ve refreshed this guide with clearer Ichimoku Cloud formulas, practical notes on signals and settings, and an updated Python walkthrough for plotting the full indicator.

What Is the Ichimoku Cloud?
The Ichimoku Cloud is a chart overlay used to judge trend direction, momentum, and possible support or resistance.
On the chart, it looks busier than a simple moving average because it draws several lines at once. The shaded area is the part most traders call the cloud. The full name is Ichimoku Kinko Hyo, which is often translated as something close to “one glance equilibrium chart.”
The idea is easier to understand if you ignore the Japanese names for a moment.
Most of the Ichimoku lines are built from the middle of a recent price range. The calculation looks at the highest high and lowest low over a chosen number of bars, then plots the midpoint between them. That is different from a normal moving average, which usually averages closing prices.
The cloud is the shaded space between two of those midpoint lines. Both cloud lines are plotted forward on the chart. This does not mean Ichimoku predicts the future. It means recent price balance is projected forward so traders can see possible future support or resistance zones.
If price is above the cloud, traders usually read the backdrop as more bullish. If price is below the cloud, they usually read it as more bearish. If price is inside the cloud, conditions are often less clear, and trend-following signals can become more mixed.
That is the basic idea before the names get involved. Ichimoku tries to show where price is, where recent balance sits, whether momentum is improving, and whether the chart has room to continue.
Ichimoku Cloud Components in Plain English
Ichimoku has five main lines. The names can make the system look harder than it is, so it helps to translate each one into its chart job.
Tenkan-sen is the fast line. It is the midpoint of the highest high and lowest low over a shorter lookback period. Traders use it to judge short-term movement.
Kijun-sen is the slower baseline. It uses the same midpoint idea, but over a longer lookback period. Traders often use it as a trend reference or pullback area.
Senkou Span A is the first cloud line. It is calculated from the fast line and the slower baseline, then shifted forward on the chart.
Senkou Span B is the second cloud line. It is based on the midpoint of a much longer high-low range, then also shifted forward on the chart.
The Kumo (cloud) is the shaded area between Senkou Span A and Senkou Span B. A thick cloud shows a wider zone between the two projected lines. A thin cloud shows a narrower zone.
Chikou Span is the current closing price shifted backward on the chart. It helps compare today’s price with where price was in the past.
So the cloud itself is not a mystery object. It is a shaded support-and-resistance zone created by two calculated lines. The rest of the Ichimoku system helps decide whether price is above, below, or tangled inside that zone.
What Ichimoku Kinko Hyo Means
Ichimoku Kinko Hyo was developed by Japanese journalist Goichi Hosoda and later published under the pen name Ichimoku Sanjin.
The origin of its naming is worth knowing because it explains the design of the indicator. Ichimoku is usually translated as “one glance.” Kinko suggests balance or equilibrium. Hyo means chart. Put together, the idea is a chart that helps a trader judge market balance at a glance.
That does not mean the chart is simple the first time you see it. For beginners, Ichimoku can look like several indicators piled on top of each other. The point is that the parts are meant to work as one system.
The system tries to answer practical chart questions.
Is price above or below its main trend zone?
Is short-term price movement improving or weakening?
Is there a nearby support or resistance area?
Is the current price clear of older price action, or is it running into congestion?
That is why the cloud is only part of the story. The shaded cloud gives the broad trend and support/resistance backdrop. The faster and slower lines help with timing. The lagging line checks today’s price against where price was in the past.
Ichimoku Cloud Formula and Components
The Ichimoku Cloud formula looks more complicated than it is because the indicator has several named lines.
The shared idea is simpler than it first looks. Most Ichimoku lines are based on the midpoint between the highest high and the lowest low over a chosen lookback period. This is not the same as a normal moving average of closing prices.
A normal simple moving average adds up closing prices and divides by the number of bars. Ichimoku usually looks at the highest and lowest prices in a range, then takes the halfway point between them.
Formula key table
| Symbol | Meaning |
|---|---|
t | current bar |
Hₜ | high at the current bar |
Lₜ | low at the current bar |
Cₜ | close at the current bar |
HH(n)ₜ | highest high over the last n bars |
LL(n)ₜ | lowest low over the last n bars |
n | lookback period |
d | displacement, usually 26 periods |
TSₜ | Tenkan-sen value at the current bar |
KSₜ | Kijun-sen value at the current bar |
SSAₜ | Senkou Span A |
SSBₜ | Senkou Span B |
CSₜ | Chikou Span |
1. Tenkan-Sen, or Conversion Line
Tenkan-sen is the faster line. It uses a shorter lookback period, usually 9 bars, and finds the midpoint of the recent high-low range.
TS_t = \frac{HH(9)_t + LL(9)_t}{2}Tenkan-sen equals the highest high over the last 9 bars plus the lowest low over the last 9 bars, divided by two.
This line reacts faster because it uses the shorter lookback period.
2. Kijun-Sen, or Base Line
Kijun-sen uses the same midpoint idea, but over a longer lookback period, usually 26 bars. Because it uses more bars, it moves more slowly than Tenkan-sen.
KS_t = \frac{HH(26)_t + LL(26)_t}{2}Kijun-sen equals the highest high over the last 26 bars plus the lowest low over the last 26 bars, divided by two.
Traders often treat Kijun-sen as a broader trend baseline or pullback reference.
3. Senkou Span A, or Leading Span A
Senkou Span A is the first cloud boundary. It is calculated from Tenkan-sen and Kijun-sen, then plotted forward on the chart.
SSA_{t+d} = \frac{TS_t + KS_t}{2}Senkou Span A equals Tenkan-sen plus Kijun-sen, divided by two, then plotted forward by the displacement value.
In the standard setting, that displacement is 26 periods.
4. Senkou Span B, or Leading Span B
Senkou Span B is the second cloud boundary. It uses a longer high-low range, usually 52 bars, then is also plotted forward.
SSB_{t+d} = \frac{HH(52)_t + LL(52)_t}{2}Senkou Span B equals the highest high over the last 52 bars plus the lowest low over the last 52 bars, divided by two, then plotted forward by the displacement value.
Because it uses a longer range, Senkou Span B often moves more slowly than Senkou Span A.
5. The cloud, or Kumo
The cloud is not a separate calculation. It is the shaded area between Senkou Span A and Senkou Span B.
Many charting platforms use one colour when Senkou Span A is above Senkou Span B and another colour when Senkou Span B is above Senkou Span A.
That colour does carry information. When Span A is above Span B, the projected cloud has a more bullish structure. When Span B is above Span A, the projected cloud has a more bearish structure. A change in colour means the two spans have crossed, which traders often call a Kumo twist.
The mistake is treating the colour change as a trade by itself. A green cloud does not automatically mean buy, and a red cloud does not automatically mean sell. The colour is a quick visual clue about the projected cloud structure. Price position, cloud thickness, Tenkan-sen, Kijun-sen and Chikou Span still matter.
\text{Kumo}_t = \text{area between } SSA_t \text{ and } SSB_tThe cloud is the space between the two leading spans. Price above the cloud usually suggests a bullish trend backdrop. Price below the cloud usually suggests a bearish backdrop. Price inside the cloud suggests a less clear or transitional area.
6. Chikou Span, or Lagging Span
Chikou Span is the current close plotted backward on the chart. It helps compare today’s price with where price was in the past.
CS_{t-d} = C_tChikou Span equals the current closing price, plotted back by the displacement value.
With the standard setting, today’s close is plotted 26 periods back.
Standard Ichimoku settings
The classic Ichimoku settings are 9, 26 and 52, with a 26-period displacement.
In plain terms, the usual setup is:
Tenkan-sen uses 9 periods.
Kijun-sen uses 26 periods.
Senkou Span B uses 52 periods.
Senkou Span A and Senkou Span B are plotted 26 periods forward.
Chikou Span is plotted 26 periods backward.
The word period simply means the chart bar being used. On a daily chart, 26 periods means 26 trading days. On an hourly chart, it means 26 hourly candles.
Once the formulas are broken down, Ichimoku becomes less mysterious. The fast line, slow line and second cloud boundary are all high-low midpoints over different lookback periods. The cloud is the shaded space between two projected lines. The lagging line is the current close shifted back on the chart.
How to Interpret Ichimoku Cloud Signals
Ichimoku signals make more sense when you read them in layers.
The first layer is price versus the cloud. If price is above the cloud, the trend backdrop is usually treated as bullish. If price is below the cloud, the backdrop is usually treated as bearish. If price is inside the cloud, the chart is often in a less clear area where trend signals can become mixed.
The second layer is the Tenkan-sen and Kijun-sen relationship. Tenkan-sen reacts faster. Kijun-sen moves more slowly. When the faster line crosses above the slower line, short-term momentum is improving. When it crosses below, short-term momentum is weakening.
The third layer is the Chikou Span. This is today’s close plotted back on the chart. It helps show whether current price is clear of older price action or running into the area where price was trading before.
| Ichimoku signal | Possible reading | Main caution |
|---|---|---|
| Price above the cloud | Bullish trend backdrop | A stretched move can still pull back |
| Price below the cloud | Bearish trend backdrop | A late short can chase weakness |
| Price inside the cloud | Unclear or transitional area | Signals are more likely to conflict |
| Tenkan-sen crosses above Kijun-sen | Short-term momentum is improving | Stronger if price is above the cloud |
| Tenkan-sen crosses below Kijun-sen | Short-term momentum is weakening | Stronger if price is below the cloud |
| Chikou Span is clear above old price action | Current price has room above past congestion | Still needs current price confirmation |
| Chikou Span is tangled in old price action | Current price is running into past congestion | Trend signals may be less clean |
| Cloud changes colour / Kumo twist | Projected cloud structure is changing | Useful warning, but not a trade signal by itself |
A basic bullish Ichimoku reading might have price above the cloud, Tenkan-sen above Kijun-sen, and Chikou Span above the price action from 26 periods earlier. That combination suggests price is above its broader support zone, short-term momentum is positive, and current price is not immediately buried in old congestion.
A basic bearish reading reverses the logic. Price is below the cloud, Tenkan-sen is below Kijun-sen, and Chikou Span is below the price action from 26 periods earlier. That suggests the chart has a bearish backdrop, weaker short-term momentum, and less support from older price structure.
The cloud itself can also be read as a zone. A thicker cloud shows a wider space between Senkou Span A and Senkou Span B. That can make the area more visible as a support or resistance zone. A thin cloud shows a narrower zone, where a break may be easier, although the chart still needs confirmation.
I would be careful with cloud colour. Many platforms shade the cloud differently depending on whether Senkou Span A is above or below Senkou Span B. The cloud colour is useful for scanning. If the cloud flips from bearish to bullish, it can warn that the projected trend backdrop is improving. If it flips from bullish to bearish, it can warn that the projected backdrop is weakening. I would still want price to confirm the change rather than trading the colour switch alone.
| Market condition | Ichimoku reading | What I would watch |
|---|---|---|
| Clear uptrend | Price above cloud; Tenkan-sen above Kijun-sen | Pullbacks toward Kijun-sen or cloud support |
| Clear downtrend | Price below cloud; Tenkan-sen below Kijun-sen | Rallies toward Kijun-sen or cloud resistance |
| Cloud breakout | Price moves from inside cloud to above or below it | Whether price holds outside the cloud |
| Cloud twist | Senkou Span A and B switch order | Possible change in trend backdrop, not a trade by itself |
| Sideways market | Price keeps moving in and out of the cloud | Avoid treating every crossover as meaningful |
The cleanest Ichimoku signals are usually aligned signals. A single Tenkan/Kijun cross inside the cloud is weaker than a cross that happens with price already above the cloud and Chikou Span clear of old price action. The system is built to be read as a group, not as five separate indicators fighting for attention.
Ichimoku Cloud Strategy Examples
An Ichimoku Cloud strategy should start with the broader chart condition. The same signal is much stronger when it agrees with the cloud than when it appears inside a messy range.
For example, a bullish Tenkan-sen and Kijun-sen cross above the cloud is usually a stronger signal than the same cross inside the cloud. A bearish cross below the cloud is usually stronger than a bearish cross while price is still above cloud support.
I would separate Ichimoku strategies into a few practical groups.
| Strategy idea | What the trader looks for | Main risk |
|---|---|---|
| Bullish cloud breakout | Price moves from inside or below the cloud to above it | False breakout if price falls back into the cloud |
| Bearish cloud breakdown | Price moves from inside or above the cloud to below it | False breakdown if price recovers back into the cloud |
| Tenkan/Kijun bullish cross | Tenkan-sen crosses above Kijun-sen | Weak if price is still inside or below the cloud |
| Tenkan/Kijun bearish cross | Tenkan-sen crosses below Kijun-sen | Weak if price is still inside or above the cloud |
| Pullback to Kijun-sen | Price pulls back toward the baseline during a trend | Pullback can become a full reversal |
| Cloud support or resistance | Price reacts at the cloud edge | The cloud can fail in choppy markets |
A simple bullish cloud breakout setup might have price closing above the cloud, Tenkan-sen above Kijun-sen, and Chikou Span clear of older price action. That combination suggests price has moved above the main trend zone, short-term momentum is supportive, and older price structure is not immediately blocking the move.
A bearish cloud breakdown reverses the logic. Price closes below the cloud, Tenkan-sen is below Kijun-sen, and Chikou Span is below older price action. That gives a cleaner bearish backdrop than one isolated cross.
Pullback strategies are different. In an uptrend, traders may watch for price to pull back toward Kijun-sen or the top of the cloud, then hold. In a downtrend, they may watch for rallies toward Kijun-sen or the underside of the cloud to fail.
The cloud can also help with trade filtering. If price is inside the cloud, I would be more cautious with trend-following entries. The chart may be in a transition zone where signals are more likely to conflict.
| Setup | Possible trigger | Confirmation to watch |
|---|---|---|
| Bullish breakout | Price closes above the cloud | Tenkan above Kijun, Chikou clear, strong close |
| Bearish breakdown | Price closes below the cloud | Tenkan below Kijun, Chikou clear, weak close |
| Bullish pullback | Price holds Kijun-sen or cloud support | Higher low, bullish candle, cloud remains below price |
| Bearish pullback | Price fails at Kijun-sen or cloud resistance | Lower high, bearish candle, cloud remains above price |
| Failed signal | Price breaks the cloud then returns inside | Avoid forcing a trend trade until direction clears |
The main thing I would avoid is turning Ichimoku into a checklist that overrides the chart. A bullish cross inside a thick cloud is not the same as a bullish cross above a clear uptrend. A cloud breakout before major news is not the same as a breakout during quiet conditions. Ichimoku helps organise the chart, but the trade still needs risk control and context.
Ichimoku Cloud Settings and Parameters
The classic Ichimoku settings are 9, 26 and 52, with a 26-period displacement.
Those numbers control the lookback periods used for the fast line, slower baseline and second cloud boundary. The displacement controls how far the cloud is plotted forward and how far the Chikou Span is plotted backward.
The standard setup is worth learning first because most charting platforms use it as the default. If you change the settings too quickly, you may end up learning your custom version rather than understanding the normal Ichimoku structure.
| Setting | Standard value | What it controls | Effect of changing it |
|---|---|---|---|
| Tenkan-sen period | 9 | Fast high-low midpoint | Shorter reacts faster; longer smooths it |
| Kijun-sen period | 26 | Slower high-low midpoint | Shorter gives earlier signals; longer gives a broader baseline |
| Senkou Span B period | 52 | Longer cloud boundary | Shorter makes the cloud more reactive; longer makes it slower |
| Displacement | 26 | Cloud forward shift and Chikou backward shift | Changes how far the cloud and lagging span are offset |
| Cloud colour | Platform-dependent | Visual relationship between Span A and Span B | Useful for scanning, but not a signal by itself |
The word period simply means the chart bar being used. On a daily chart, 26 periods means 26 trading days. On an hourly chart, it means 26 hourly candles. On a five-minute chart, it means 26 five-minute candles.
This matters because Ichimoku can look very different across timeframes. A clean cloud trend on a daily chart may be noisy on a short intraday chart. A Tenkan/Kijun cross on a lower timeframe may be a small pullback inside a much larger trend.
Some traders adjust Ichimoku settings for modern five-day trading weeks or for faster markets. That can be reasonable, but it changes the indicator’s behaviour. A faster setup will create more crosses and more cloud changes. A slower setup will filter more noise but react later.
| What you see | Possible issue | What to test |
|---|---|---|
| Constant Tenkan/Kijun crosses | Settings may be too fast or market may be choppy | Use the cloud as a stronger filter |
| Price often trapped inside the cloud | Market may be range-bound or transitional | Avoid forcing trend trades |
| Signals arrive too late | Settings may be too slow for the timeframe | Compare with a slightly faster setup |
| Cloud flips colour constantly | Trend backdrop may be unstable | Wait for price to clear the cloud |
| Chikou Span is tangled in old price | Current price may be facing congestion | Look for cleaner structure before acting |
I would treat the default settings as the baseline. Change them only if you have a reason, and then test the change across more than one chart. If the new settings only make the last few signals look better, they may be curve-fitted rather than genuinely useful.
Pros and Cons of the Ichimoku Cloud
Ichimoku’s main strength is that it puts several pieces of trend information on one chart. Price position, short-term momentum, baseline trend, projected support and resistance, and lagging confirmation can all be checked in one view.
That is also why it can be difficult for beginners. A chart with five Ichimoku lines and a shaded cloud can look crowded until each part has a clear job.
| Strength | Why it helps |
|---|---|
| Shows trend backdrop | Price above, below or inside the cloud gives a quick trend context |
| Combines timing and confirmation | Tenkan-sen, Kijun-sen and Chikou Span add more than the cloud alone |
| Gives dynamic support and resistance | The cloud can act as a projected support or resistance zone |
| Works across markets and timeframes | The same structure can be applied to stocks, futures, forex and crypto |
| Helps filter weak signals | A crossover against the cloud is easier to treat with caution |
The weaknesses come from the same design. Ichimoku gives a lot of information, but more information does not automatically mean a cleaner trade.
Sideways markets are the biggest problem. If price keeps moving in and out of the cloud, Tenkan-sen and Kijun-sen can cross repeatedly without producing a clean trend. In that environment, the cloud is less useful as a trend filter and more of a warning that the market lacks direction.
Ichimoku is also based on historical highs, lows and closes. The cloud is plotted forward, but it is not forecasting future price. It is projecting recent balance forward on the chart.
| Limitation | What can go wrong |
|---|---|
| Busy chart | Beginners may not know which signal matters most |
| Weak in sideways markets | Price can move in and out of the cloud with repeated false signals |
| Still based on past price | Forward plotting does not make the cloud predictive |
| Settings affect behaviour | Faster settings can create noise; slower settings can react late |
| Can encourage overconfirmation | Waiting for every line to agree may produce late entries |
Used well, Ichimoku can organise a chart quickly. Used badly, it can become a colourful mess of lines that makes the trader feel informed without giving a clean decision. I would treat it as a structured trend-reading system, not a shortcut around price action and risk control.
Coding the Ichimoku Cloud with Python
Now we can calculate the Ichimoku Cloud in Python and plot it on a chart.
This version calculates the five Ichimoku components, plots the Tenkan-sen and Kijun-sen lines, shades the cloud between Senkou Span A and Senkou Span B, and adds Chikou Span as the closing price shifted backward on the chart.
The important detail is that the cloud is plotted forward. In the code, we calculate the cloud lines from current and past price data, then shift where they are drawn on the x-axis. That is how the projected cloud appears ahead of the latest candle.
Step 1: Install the Python libraries
python -m pip install pandas yfinance numpy matplotlib mplfinanceIf your Windows setup uses the py launcher, this version may work better:
py -m pip install pandas yfinance numpy matplotlib mplfinancePandas handles the data table, yfinance downloads price data, NumPy helps with chart preparation, matplotlib builds the figure, and mplfinance provides the candlestick plotting function.
Step 2: Create the file and import the libraries
Save a new file as ichimoku_cloud.py, then paste the following imports at the top.
import numpy as np
import pandas as pd
import yfinance as yf
import matplotlib.pyplot as plt
from mplfinance.original_flavor import candlestick_ohlc
Step 3: Add the chart settings
ticker = "PLTR"
start_date = "2025-05-10"
end_date = "2026-05-10"

tenkan_period = 9
kijun_period = 26
senkou_b_period = 52
displacement = 26This example uses Palantir with the standard Ichimoku settings of 9, 26 and 52 periods, plus a 26-period displacement. You can reuse the script with another ticker or date range by changing these settings.
Step 4: Download the price data
data = yf.download(
    ticker,
    start=start_date,
    end=end_date,
    auto_adjust=True,
    progress=False,
    multi_level_index=False
)

if isinstance(data.columns, pd.MultiIndex):
    data.columns = data.columns.get_level_values(0)

data.index = pd.DatetimeIndex(data.index)
data = data.dropna(subset=["Open", "High", "Low", "Close", "Volume"])

if data.empty:
raise ValueError("No price data downloaded. Check the ticker and date range.")The auto_adjust=True setting means the OHLC data is adjusted for splits and dividends. The MultiIndex fallback is included because yfinance can return multi-level columns depending on version and settings.
Step 5: Define the Ichimoku calculation
def calculate_ichimoku(
    price_data,
    tenkan_period=9,
    kijun_period=26,
    senkou_b_period=52
):
    df = price_data.copy()

    high = df["High"]
    low = df["Low"]

    df["Tenkan_Sen"] = (
        high.rolling(window=tenkan_period).max()
        + low.rolling(window=tenkan_period).min()
    ) / 2

    df["Kijun_Sen"] = (
        high.rolling(window=kijun_period).max()
        + low.rolling(window=kijun_period).min()
    ) / 2

    df["Senkou_Span_A"] = (
        df["Tenkan_Sen"] + df["Kijun_Sen"]
    ) / 2

    df["Senkou_Span_B"] = (
        high.rolling(window=senkou_b_period).max()
        + low.rolling(window=senkou_b_period).min()
    ) / 2

    df["Chikou_Span"] = df["Close"]

return dfThe Tenkan-sen, Kijun-sen and Senkou Span B calculations all use the same high-low midpoint idea. Senkou Span A averages Tenkan-sen and Kijun-sen. Chikou Span is the close, which we plot backward later.
Step 6: Add the Ichimoku columns
data = calculate_ichimoku(
    data,
    tenkan_period=tenkan_period,
    kijun_period=kijun_period,
    senkou_b_period=senkou_b_period
)

plot_data = data.dropna(
    subset=["Tenkan_Sen", "Kijun_Sen", "Senkou_Span_A", "Senkou_Span_B"]
).copy()

if plot_data.empty:
raise ValueError("Not enough valid data to calculate Ichimoku Cloud.")The first rows are removed because the longer Ichimoku lines need enough bars before they can be calculated.
Step 7: Prepare the chart data
plot_data["Bar"] = np.arange(len(plot_data))

ohlc = plot_data[["Bar", "Open", "High", "Low", "Close"]].values

volume_colors = np.where(
    plot_data["Close"] >= plot_data["Open"],
    "green",
    "red"
)

cloud_x = plot_data["Bar"] + displacement
chikou_x = plot_data["Bar"] - displacementThe Bar column gives the chart a clean trading-bar x-axis. cloud_x moves the cloud forward, while chikou_x moves the Chikou Span backward.
Step 8: Create the Ichimoku price chart
fig, (ax_price, ax_volume) = plt.subplots(
    2,
    1,
    figsize=(13, 7),
    sharex=True,
    gridspec_kw={
        "height_ratios": [4, 1],
        "hspace": 0.0
    }
)

fig.suptitle(
    f"{ticker} with Ichimoku Cloud",
    fontsize=12,
    fontweight="bold"
)

candlestick_ohlc(
    ax_price,
    ohlc,
    width=0.6,
    colorup="green",
    colordown="red",
    alpha=0.85
)

ax_price.plot(
    plot_data["Bar"],
    plot_data["Tenkan_Sen"],
    label="Tenkan-sen",
    color="red",
    linewidth=1.0
)

ax_price.plot(
    plot_data["Bar"],
    plot_data["Kijun_Sen"],
    label="Kijun-sen",
    color="blue",
    linewidth=1.0
)

ax_price.plot(
    cloud_x,
    plot_data["Senkou_Span_A"],
    label="Senkou Span A",
    color="green",
    linewidth=0.9
)

ax_price.plot(
    cloud_x,
    plot_data["Senkou_Span_B"],
    label="Senkou Span B",
    color="brown",
    linewidth=0.9
)

ax_price.fill_between(
    cloud_x,
    plot_data["Senkou_Span_A"],
    plot_data["Senkou_Span_B"],
    where=plot_data["Senkou_Span_A"] >= plot_data["Senkou_Span_B"],
    color="green",
    alpha=0.16,
    interpolate=True
)

ax_price.fill_between(
    cloud_x,
    plot_data["Senkou_Span_A"],
    plot_data["Senkou_Span_B"],
    where=plot_data["Senkou_Span_A"] < plot_data["Senkou_Span_B"],
    color="red",
    alpha=0.14,
    interpolate=True
)

valid_chikou = chikou_x >= 0

ax_price.plot(
    chikou_x[valid_chikou],
    plot_data.loc[valid_chikou, "Chikou_Span"],
    label="Chikou Span",
    color="purple",
    linewidth=1.0,
    linestyle="--"
)

ax_price.set_ylabel("Price")
ax_price.legend(loc="upper left", fontsize=8)
ax_price.grid(True, alpha=0.25)

ax_volume.bar(
    plot_data["Bar"],
    plot_data["Volume"],
    color=volume_colors,
    width=0.6,
    alpha=0.55
)

ax_volume.set_ylabel("Volume")
ax_volume.grid(True, alpha=0.25)The price panel includes the candlesticks, Tenkan-sen, Kijun-sen, Chikou Span, and the shaded cloud. The cloud is drawn ahead of price by the displacement setting.
Step 9: Add date labels, save and show the chart
tick_count = 9
tick_positions = np.linspace(0, len(plot_data) - 1, tick_count, dtype=int)
tick_labels = plot_data.index[tick_positions].strftime("%Y-%m-%d")

ax_volume.set_xticks(tick_positions)
ax_volume.set_xticklabels(tick_labels, rotation=45, ha="right")

plt.setp(ax_price.get_xticklabels(), visible=False)

ax_price.set_xlim(0, len(plot_data) + displacement)

fig.subplots_adjust(
    top=0.90,
    bottom=0.16,
    left=0.08,
    right=0.97,
    hspace=0.0
)

output_file = "ichimoku_cloud_python_chart.png"
fig.savefig(output_file, dpi=150, bbox_inches="tight")

print(f"Saved chart as {output_file}")

plt.show()The script saves the chart as ichimoku_cloud_python_chart.png and opens the chart window.
Step 10: Run the script
Run the file from VS Code, or use this command in the terminal:
python ichimoku_cloud.pyIf your Windows setup uses the py launcher, use:
py ichimoku_cloud.pyYou should get a two-panel chart with candlesticks, volume, the Ichimoku lines and the shaded cloud. The cloud is projected forward, while the Chikou Span is shifted backward. Hopefully it looks like mine here:
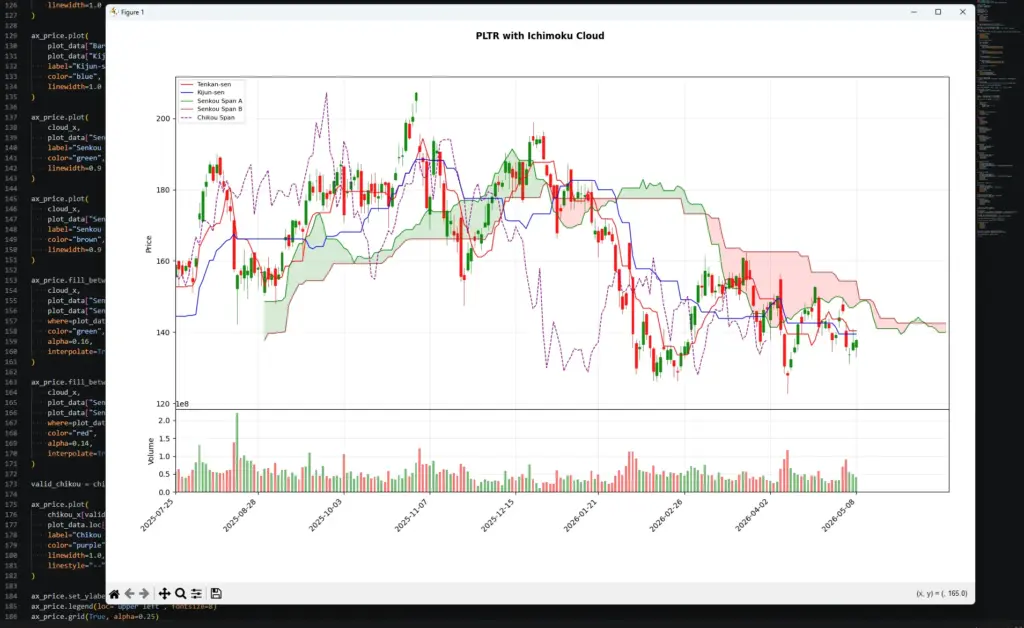
This chart shows why Ichimoku is usually read as a group of signals rather than one line at a time. On the left and middle of the chart, price spends time around or above the cloud, where the cloud can act more like a trend-support area. The sharp selloff into early 2026 then breaks price below the cloud, while Tenkan-sen and Kijun-sen turn lower. The projected cloud also shifts into a more bearish-looking colour structure, which warns that the forward support/resistance backdrop has changed.
By the right side of the chart, price is trying to recover, but it is still dealing with the cloud and the slower baseline above it. That is not the same as a clean bullish Ichimoku setup. A cleaner bullish reading would usually need price back above the cloud, Tenkan-sen above Kijun-sen, Chikou Span less tangled in older price action, and a projected cloud structure that no longer argues against the move.
Ichimoku Cloud for Day Trading and Scalping
Ichimoku can be used on intraday charts, but shorter timeframes make the system noisier.
On a daily chart, the cloud may show a clear trend backdrop. On a five-minute chart, price can move in and out of the cloud repeatedly, Tenkan-sen and Kijun-sen can cross often, and the Chikou Span can become less useful because older price action is crowded together.
For day trading, I would treat Ichimoku as a filter first and a signal tool second.
If price is above the cloud and the cloud structure is bullish, long setups have a better backdrop. If price is below the cloud and the cloud structure is bearish, short setups have a better backdrop. If price is inside the cloud, the chart may be too mixed for clean trend-following.
| Intraday situation | What Ichimoku can help show | What still needs checking |
|---|---|---|
| Price is above the cloud | Bullish intraday trend backdrop | Entry location, resistance, volume |
| Price is below the cloud | Bearish intraday trend backdrop | Support below, failed-break risk |
| Price is inside the cloud | Mixed or transitional conditions | Whether no trade is better |
| Tenkan/Kijun cross above the cloud | Short-term momentum supports the trend | Whether the move is already stretched |
| Tenkan/Kijun cross inside the cloud | Momentum is shifting, but trend is unclear | Cloud break or price confirmation |
| Cloud flips colour | Projected structure is changing | Price still needs to confirm |
For scalping, the biggest danger is over-reading every line movement. A fast Tenkan/Kijun cross on a short timeframe can look important, but it may only be noise inside a wider range.
A simple day-trading process would be:
First, check where price is relative to the cloud.
Second, check whether Tenkan-sen and Kijun-sen agree with that direction.
Third, check whether price is near a clean level, such as cloud support, cloud resistance, a previous high, a previous low, or a session range boundary.
Fourth, decide whether the stop distance makes sense before treating the signal as tradable.
The cloud can also help a day trader avoid poor conditions. If price keeps moving in and out of the cloud, and the cloud keeps twisting colour, the market may not have a clean trend. In that case, Ichimoku is warning that the chart is messy rather than giving a strong signal.
| Mistake | Better habit |
|---|---|
| Trading every Tenkan/Kijun cross | Filter crosses by cloud position |
| Treating cloud colour as a trade signal | Use colour as a structure clue only |
| Scalping inside a messy cloud | Wait for price to clear the cloud or use a range strategy |
| Ignoring higher timeframe trend | Check whether the intraday setup fights the bigger chart |
| Using Ichimoku for stops alone | Combine it with price structure and defined risk |
Used well, Ichimoku can help day traders decide whether the chart has a bullish, bearish, or mixed backdrop. Used badly, it becomes a busy screen full of crosses and colour changes. For shorter timeframes, I would keep the question simple: is price clear of the cloud, are the faster lines aligned, and does the trade have a clean risk point?
Ichimoku vs Other Indicators
Ichimoku is different from most single-purpose indicators because it tries to show several things at once.
A moving average shows a smoothed price line. RSI shows momentum and stretched conditions. MACD shows moving-average momentum. ATR shows volatility. Ichimoku tries to combine trend backdrop, faster and slower balance lines, projected support or resistance, and lagging confirmation.
That makes it useful, but it also means it can be overused. If Ichimoku is already giving you trend, timing and support/resistance context, adding too many extra indicators can make the chart harder to read rather than easier.
| Indicator | Main job | How it differs from Ichimoku | Useful pairing idea |
|---|---|---|---|
| Moving averages | Smooth price direction | Ichimoku uses high-low midpoints and projected cloud lines, not only averages of closes | A moving average can simplify the broader trend view |
| RSI | Measures momentum and stretched conditions | RSI is an oscillator; Ichimoku is a price-chart overlay | RSI can help judge whether an Ichimoku move is stretched |
| MACD | Tracks moving-average momentum | MACD focuses on momentum crossover signals; Ichimoku also maps cloud support/resistance | MACD can support momentum confirmation |
| Bollinger Bands | Show volatility bands around price | Bollinger Bands expand with volatility; Ichimoku projects high-low balance zones | Bands can help judge volatility around cloud breaks |
| ATR | Measures average range | ATR has no directional signal; Ichimoku does | ATR can help with stop distance and risk sizing |
| Parabolic SAR | Gives trend-following stop-and-reversal points | SAR gives direct trailing points; Ichimoku gives broader structure | SAR can help manage a trend after Ichimoku confirms backdrop |
| Donchian Channels | Show recent highs and lows | Donchian Channels draw breakout ranges; Ichimoku uses midpoints of high-low ranges | Useful for comparing cloud breaks with range breaks |
I would be careful about adding indicators that duplicate the same job. For example, if Tenkan-sen and Kijun-sen already give a short-term and medium-term balance view, adding several more moving averages may not improve the decision.
The better question is what is missing.
If the problem is stop placement, ATR may help more than another trend line.
If the problem is whether the move is stretched, RSI may add useful context.
If the problem is whether price is breaking a clean range, Donchian Channels or simple support and resistance may help.
If the problem is trend structure, Ichimoku may already be doing the heavy lifting.
The cleanest charts usually give each tool a job. Ichimoku can define the trend backdrop and possible support or resistance zones. Another indicator can add momentum, volatility or risk context. The chart becomes weaker when every indicator is asked to vote on the same thing.
Frequently Asked Questions about the Ichimoku Cloud
Q: What is the Ichimoku Cloud?
The Ichimoku Cloud is a technical analysis overlay that plots several lines on the price chart. The shaded cloud is the area between Senkou Span A and Senkou Span B. Traders use it to judge trend direction, support, resistance, momentum and possible confirmation.
Q: What does Ichimoku Kinko Hyo mean?
Ichimoku Kinko Hyo is often translated as something close to “one glance equilibrium chart.” The name reflects the idea that a trader should be able to judge the market’s balance and trend condition from one chart view.
Q: What is the cloud in Ichimoku?
The cloud, or Kumo, is the shaded area between Senkou Span A and Senkou Span B. It can act as a projected support or resistance zone. Price above the cloud is usually read as a bullish backdrop. Price below the cloud is usually read as bearish. Price inside the cloud is often less clear.
Q: What do the Ichimoku cloud colours mean?
Many charting platforms use one colour when Senkou Span A is above Senkou Span B and another colour when Senkou Span B is above Senkou Span A. A colour change, often called a Kumo twist, can warn that the projected cloud structure is changing. It is not a trade signal by itself.
Q: What are the standard Ichimoku settings?
The classic Ichimoku settings are 9, 26 and 52, with a 26-period displacement. Tenkan-sen uses 9 periods, Kijun-sen uses 26 periods, Senkou Span B uses 52 periods, and the cloud is usually plotted 26 periods forward.
Q: Is Ichimoku a moving average system?
Not in the usual closing-price average sense. Most Ichimoku lines are based on the midpoint between the highest high and lowest low over a lookback period. That is different from a simple moving average that averages closing prices.
Q: What is a bullish Ichimoku signal?
A cleaner bullish reading usually has price above the cloud, Tenkan-sen above Kijun-sen, and Chikou Span clear of older price action. A single bullish cross inside the cloud is weaker because the trend backdrop is still mixed.
Q: What is a bearish Ichimoku signal?
A cleaner bearish reading usually has price below the cloud, Tenkan-sen below Kijun-sen, and Chikou Span below older price action. A bearish cross above the cloud is less convincing because price may still have a bullish support backdrop.
Q: Can Ichimoku be used for day trading?
Yes, but shorter timeframes are noisier. On intraday charts, price can move in and out of the cloud often, and Tenkan/Kijun crosses can become less reliable. I would use the cloud as a trend filter first, then look for price confirmation.
Q: Is Ichimoku good in sideways markets?
Ichimoku is usually less useful in messy sideways markets. If price keeps moving through the cloud and the cloud keeps twisting, the system is often warning that the chart lacks clean direction.
Final Thoughts
The Ichimoku Cloud looks complicated because it shows several pieces of information at once. Once the pieces are separated, the logic is easier to follow.
The fast line shows short-term balance. The base line gives a slower reference point. The cloud shows a projected support or resistance zone. The lagging line compares today’s price with older price action.
The cloud colour can help with scanning, but it should not be treated as a buy or sell signal on its own. A green-looking cloud is not enough. A red-looking cloud is not enough either. The stronger readings come when price, cloud position, Tenkan-sen, Kijun-sen and Chikou Span all support the same direction.
I would treat Ichimoku as a chart-reading framework rather than a mechanical trading system. It can help organise trend, momentum and support or resistance, but the trade still needs price structure, risk control and awareness of the broader market.
Further Reading
Related AlphaSquawk guides:
Moving Averages, for a simpler trend-following baseline.
RSI, for momentum and stretched-condition analysis.
MACD, for moving-average momentum and crossover signals.
Bollinger Bands, for volatility bands around price.
Keltner Channels, for ATR-based trend channels.
Average True Range, for volatility and stop-distance context.
Parabolic SAR, for a trend-following stop-and-reversal tool.
Donchian Channels, for breakout ranges based on recent highs and lows.
Books and references:
Elliott, N. (2018). Ichimoku Charts: An Introduction to Ichimoku Kinko Clouds. (2nd Ed.) Harriman Trading
Péloille, K. (2017). Trading with Ichimoku: A practical guide to low-risk Ichimoku strategies (1st ed.). Harriman House


