Why bonds are back in the spotlight
For long stretches, bond markets sit in the background. They are not as easy to follow as stocks, and they rarely produce the same clean story as a share price going up or down. But when bonds move sharply, the effects spread everywhere: mortgages, pensions, company borrowing costs, government budgets, currencies and stock-market valuations.
That is why bond markets are worth understanding even if you never plan to buy a gilt, Treasury or corporate bond yourself. They are where investors price time, inflation, credit risk and confidence in governments and companies.
The recent U.S.-Iran shock was a good example. Oil prices jumped as traders worried about disruption through the Strait of Hormuz, then fell sharply after the ceasefire was announced, before bouncing again as markets questioned how durable the truce really was. One geopolitical event quickly became an inflation story, a central-bank story, a mortgage-rate story and a government-borrowing-cost story.
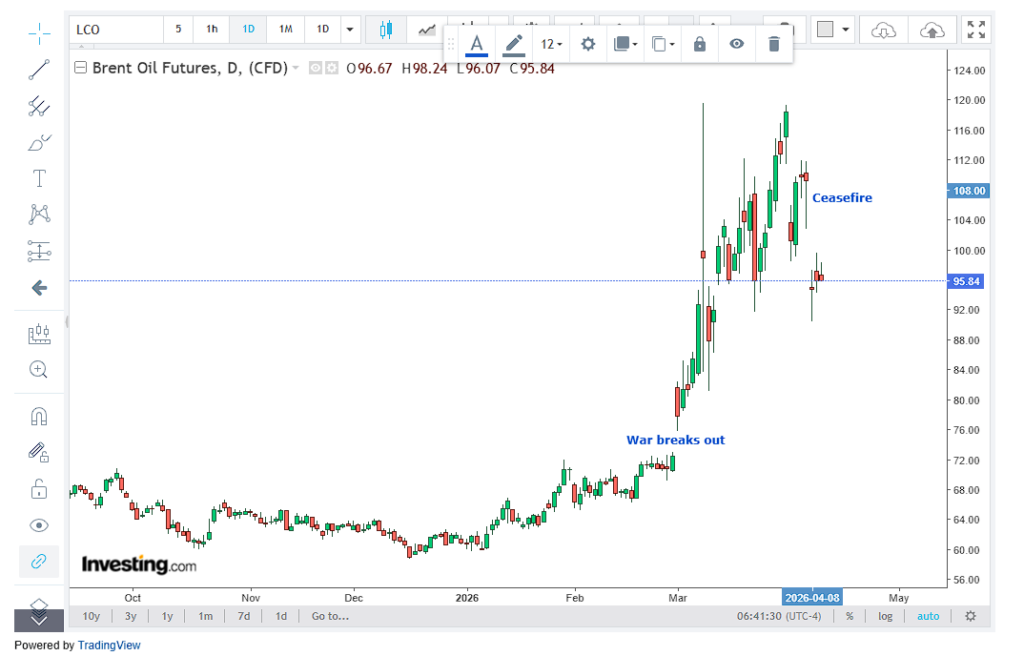
For bonds, the key point is that oil does not stay in the oil market. It spills into inflation expectations, central-bank thinking, transport costs, mortgage pricing and government funding costs. In the United States, Reuters reported that the average 30-year fixed mortgage rate rose to 6.46% in early April as Treasury yields climbed during the conflict. In India, the benchmark 10-year government bond yield jumped 6 basis points in one session as oil rose again and confidence in the ceasefire faded. (Reuters)
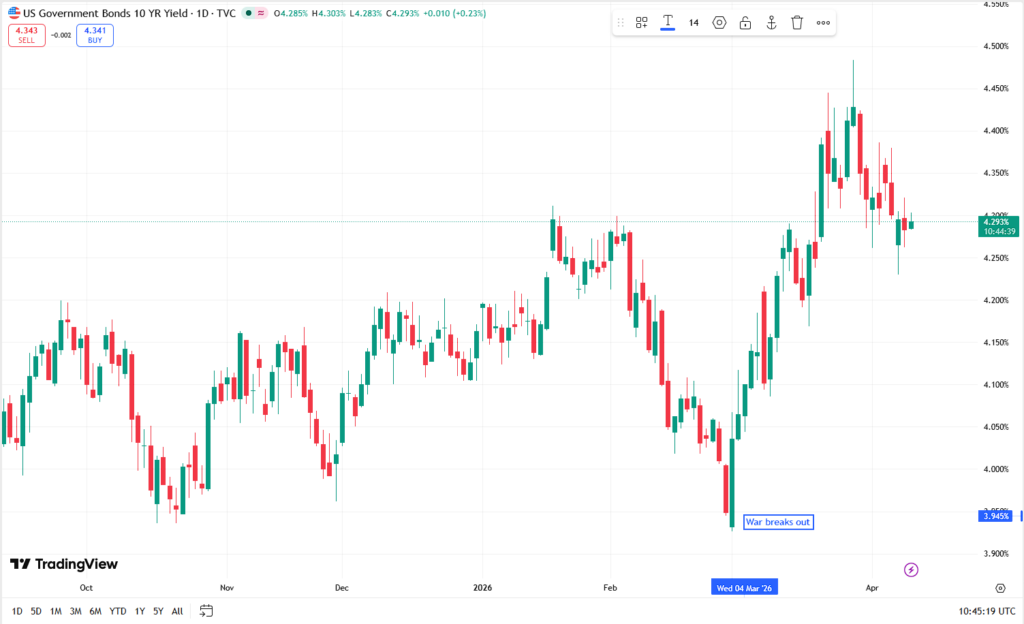
The quick version is simple enough. When investors think inflation may stay higher for longer, or that central banks may have less room to cut rates, bond yields tend to rise as bonds are sold down to lower prices. When traders scramble for safety, or decide that growth is about to weaken, government bond prices tend to rally and yields fall.
Around the ceasefire, those forces pulled in opposite directions. Relief pushed oil lower and supported government bonds at first. But the calm did not last. By the following session, markets were already questioning the durability of the truce, the lack of any quick return to normal shipping through the Strait of Hormuz, and the risk that expensive energy could keep inflation uncomfortable even as growth slowed.
Oil rebounded, some of the earlier move in yields reversed, and the market was back to weighing relief against stagflation risk. Goldman Sachs cut its second-quarter 2026 Brent forecast to $90 after the ceasefire, but still warned that prices could jump back toward $115 in a more severe disruption scenario. (Reuters)
That is the bond-market problem in miniature. The same event can pull yields in different directions at once. Inflation risk pushes one way. Growth fear pushes another. Safe-haven demand, oil prices, central-bank expectations and government borrowing all get folded into the same market price.
The rest of this guide starts with the basics and works outward. We will look at what a bond actually is, why yields move opposite to prices, why long-dated bonds are more volatile than short-dated ones, what the yield curve is telling you, and how corporate bonds add another layer of risk through credit spreads and structures such as bank AT1s. The goal is not to turn this into a textbook. It is to make bond headlines easier to read the next time yields jump and someone says the market is “sending a message”.
What a bond actually is
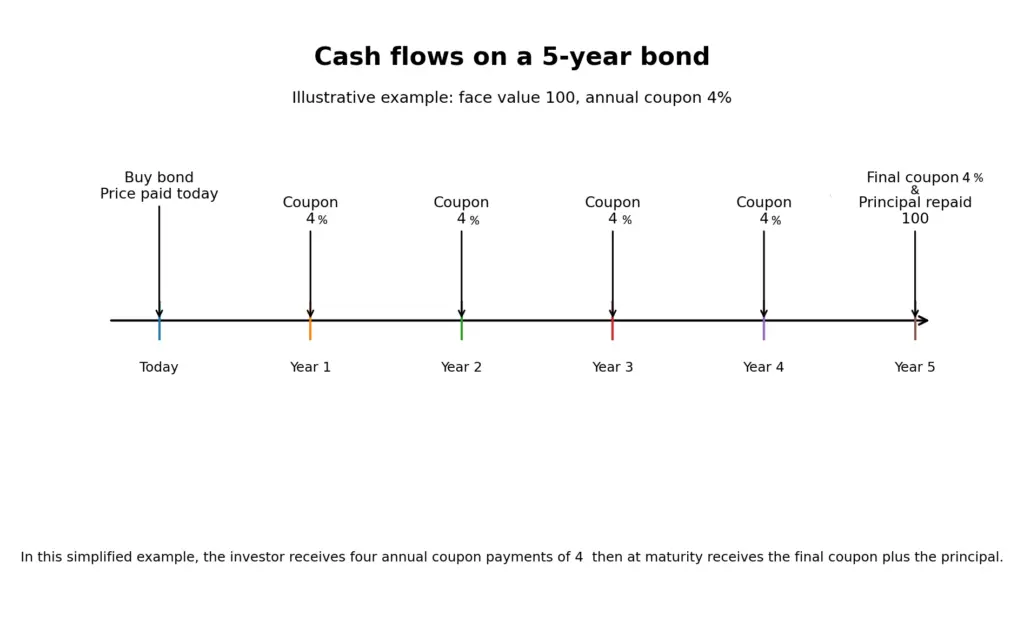
At heart, a bond is just a loan that can be traded. An investor lends money to a government, company or other borrower, and in return receives a promise: a schedule of interest payments and the return of the principal, meaning the amount originally lent at a set date in the future.
The basic idea is simple enough. The complications come later, once that promise starts trading in the market and investors begin arguing over what it is worth.
A plain-vanilla bond usually has four moving parts. There is the issuer, which is the borrower. There is the face value or par value, usually quoted as 100, which is the amount repaid at maturity (principal). There is the coupon, which is the interest payment attached to the bond. And there is the maturity, the date when the issuer is meant to repay the principal.
Take a government bond with a face value of 100, a coupon of 4% and a maturity of 10 years. If you buy it when it is first issued and hold it all the way to the end, you should receive the 4% coupon each year and then get your 100 back at maturity. In that sense, a bond is more predictable than a share. A shareholder does not know what dividends will be paid in ten years’ time, or what price the shares will trade at. A bondholder at least has a contractual payment schedule to work from, assuming the issuer stays solvent and doesn’t default on repayments.
The safety point needs care. Bonds are often described as safer than equities, but that depends on what sort of bond you are talking about. A low-yielding U.S. Treasury bond is not the same thing as a small company’s high-yield bond, where investors demand more return for taking more risk. Even within one issuer’s capital structure, some bonds are much safer than others. Senior debt, subordinated debt and bank capital instruments can all behave very differently when a borrower gets into trouble. We will come back to that later when we get to corporate credit and AT1s.
It is also worth separating bonds from cash. Cash in a deposit account does not jump around in price from one day to the next. A bond does. You may still get your coupon and principal if you hold it to maturity, but in the meantime its market value can rise or fall, sometimes quite sharply. That is why bond market headlines are really about two things at once: lending money, and re-pricing that loan every day as the world changes.
If you are new to bonds, the vocabulary can make them seem more exotic than they really are. In practice, most of the jargon comes back to a handful of ideas: how much you lend, what income you receive, when you get repaid, and how confident the market is that the whole arrangement is attractive at the current price.
Key bond terms
- Issuer: the government, company or institution borrowing the money
- Par value (a.k.a. face value or principal): the amount due back at maturity, usually quoted as 100
- Coupon: the regular interest payment on the bond
- Maturity: the date when the bond is repaid
- Price: what the bond trades for in the market today
- Yield: the return implied by that market price
Why bond prices and yields move in opposite directions
Once you know what cash flows a bond promises, the next question is how the market puts a price on them. The basic idea is not difficult. A bond promises a series of fixed cash payments, which is why people often refer to bonds as part of the fixed-income market. Once that bond starts trading in the market, the future cash flows stay the same, but the price people are willing to pay for them changes. Yield is simply the return implied by that changing price.
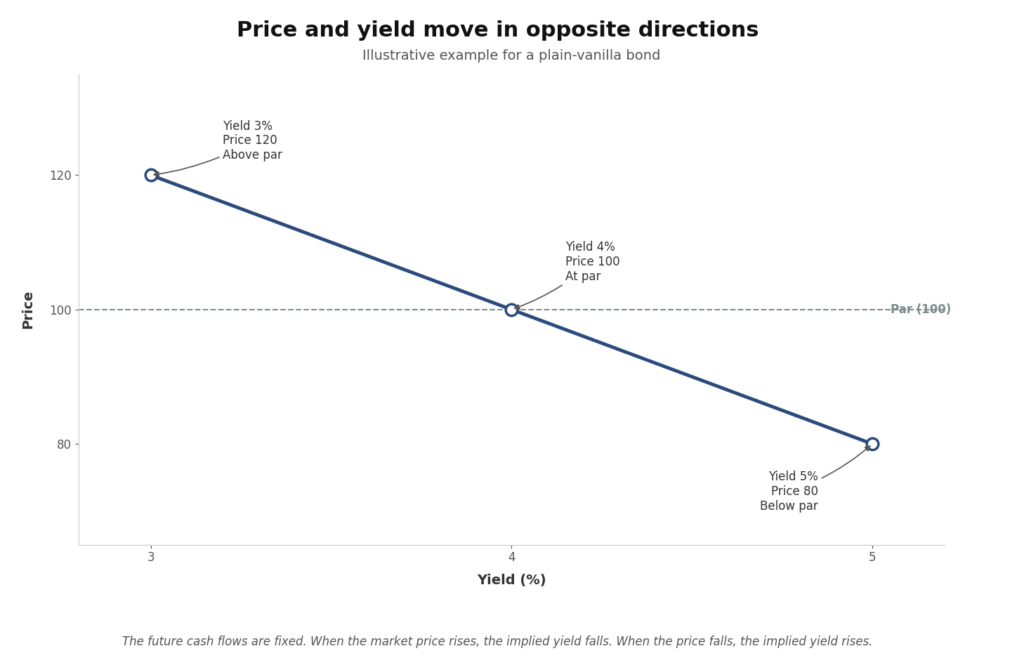
If you know the bond will pay the same coupons and the same final principal regardless of who owns it, then a higher purchase price must mean a lower return for the next buyer. A lower purchase price must mean a higher return. That is why bond prices and yields move in opposite directions.
A simple example helps. Imagine a bond with a face value of 100 and an annual coupon of 4. If that bond is trading at exactly 100, the yield is 4%. If enthusiasm for the bond rises and investors bid the price up to 105, the buyer is still only getting the same fixed coupon payments and the same 100 back at maturity. Paying more upfront for the same cash flows means accepting a lower return, so the yield falls. If the price drops to 95, the reverse happens: the buyer gets the same future payments for less money, so the yield rises.
This is why bond market headlines are usually written in terms of yields rather than prices. Yield is the more useful comparison tool. One bond may have a 2% coupon and another may have a 5% coupon, but once both are trading in the market, investors want a common language to judge which one is cheap, which one is expensive and how both compare with cash rates, inflation and other bonds.
It also explains why bonds can look odd to people coming from equities. In the stock market, rising prices are usually treated as good news in themselves. In bond markets, a rising price often means falling yields, and falling yields may reflect anything from expectations of lower interest rates to a flight into safety during a market scare. The move in the price matters, but the reason behind the move matters more.
In practice, traders tend to watch changes in yield first and price second. If the U.S. 10-year Treasury yield rises from 4.10% to 4.30%, that tells you straight away that the market has marked down the value of those future cash flows. The price has fallen. You do not even need to know the exact price to understand the direction of travel.
That inverse relationship sits at the centre of the whole bond market. Once you have it clear in your head, the rest of the subject becomes much easier. When yields rise, existing bondholders take a mark-to-market hit because their older bonds are suddenly less attractive than newly issued ones. When yields fall, existing bond prices rise because those older bonds with higher locked-in coupons look more valuable.
A quick numerical example
Suppose a bond pays a fixed coupon of 4 each year and returns 100 at maturity.
- If it trades at 100, its yield is 4%
- If it trades at 105, its yield is below 4%
- If it trades at 95, its yield is above 4%
The cash flows have not changed. Only the market price has.
Not all bonds repay the same way
Many bonds repay principal in one lump sum at maturity. In market language, those are often called bullet bonds.
A bullet bond repays the principal in one lump sum at the end. Until then, the investor usually just receives the coupon. If a bond has a face value of 100, the holder gets the coupons during its life and then the full 100 back at maturity.
Not every bond works that way. Some are amortising bonds, where the principal is paid back gradually over time rather than all at once. Others may have sinking fund features, where part of the debt is scheduled to be retired before the final maturity. Some are callable, meaning the issuer has the right to repay them early under certain conditions.
And some, especially in hybrid corporate and bank-capital markets, do not have a fixed maturity date in the normal sense at all. These are usually called perpetual bonds, perps, or simply perpetual securities.
A normal bond has a defined end date when the issuer repays the principal. A perpetual bond does not promise that full repayment on a set date. Instead, it may keep paying coupons indefinitely unless the issuer chooses, or is required, to redeem it. That is why perpetuals sit awkwardly between ordinary bonds and equity. They look bond-like because they pay income, but they can behave more like hybrids because the investor may never get the principal back on a fixed schedule.
That has an important practical consequence for investors. With an ordinary bullet bond, assuming the issuer stays solvent, holding it to maturity usually means getting your principal back at par. With a perpetual bond, there may be no such maturity date to wait for. If the issuer does not call the bond, the investor often has to sell it in the market to get out, which means receiving whatever the market price happens to be at the time.
In other words, a perpetual bond may offer a higher yield, but it does not give the same certainty of principal repayment as a standard bond maturing at 100. If market conditions have moved against you and the bond is trading below par, you may have to accept that loss if you want to exit.
In practice, many perpetual corporate or bank-capital instruments are issued with a first call date, often five or ten years after issue. That is not a maturity date. It is simply the first point at which the issuer can choose to redeem the bond. If it does not, the bond may remain outstanding for many more years, or in theory indefinitely.
That is one reason these instruments can confuse newer readers. A bond that matures in 2031 is easy enough to picture. A perpetual bond that is callable in 2031 is different: 2031 may be the first date on which the issuer can redeem it, not the date on which it must.
This also affects how investors talk about returns. With an ordinary bond, people often focus on yield to maturity. With callable or perpetual bonds, they may focus instead on yield to call, meaning the return if the issuer redeems the bond at the first call date. If the bond is not called, investors have to think beyond the first call date and consider what the income stream may be worth if the bond stays outstanding indefinitely.
There are also bonds with conversion features. A convertible bond usually gives the investor the option to convert the bond into shares under certain terms. That means it sits somewhere between debt and equity. It still has bond features, but part of its appeal may come from the possibility that the company’s share price rises enough to make conversion attractive. In banks, AT1 or CoCo instruments are different again: they are often perpetual in structure, often callable, and may be written down or converted into equity in stress.
These differences matter because they affect cash flow, interest-rate sensitivity, legal risk and trading behaviour. A bullet bond leaves the investor waiting for the full principal repayment at the end, which makes the final maturity date especially important. An amortising bond returns capital earlier, which changes its cash-flow profile and often reduces its rate sensitivity compared with an otherwise similar bullet bond. A perpetual bond may never repay principal on a fixed schedule, which makes coupon terms, call dates and ranking in the capital structure much more important.
That is why some traders, especially in riskier sovereign or distressed debt markets, talk about “buying the bullets.” In plain English, they mean they prefer bonds with a clear final principal repayment at maturity rather than more complicated repayment structures. In troubled credits, the exact legal promise and payment schedule can matter a great deal. If you are buying a distressed sovereign dollar bond from a country such as Venezuela or, in earlier periods, Russia, you are not just asking whether you will be paid. You are also asking when, how, and under what legal terms.
For a general reader, the main point is simple: two bonds can have the same issuer, the same currency and even a similar maturity, but still behave differently because their repayment structures are different. Coupon is only part of the story. The shape of the principal repayment matters too, and in some cases there may be no fixed repayment date at all.
Quick recap: bond repayment structures
- Bullet bond: principal repaid in one lump sum at maturity
- Amortising bond: principal repaid gradually over time
- Sinking fund bond: part of the debt is retired before final maturity
- Callable bond: issuer may repay early on specified dates
- Perpetual bond / perp: no fixed maturity date
- Yield to call: return if the bond is redeemed at the first call date
- Convertible bond: bond that may be converted into shares under set terms
- AT1 / CoCo: hybrid bank-capital instruments, explained in more detail later, often perpetual and callable, designed to absorb losses in stress
- Repayment structure affects cash flow, interest-rate sensitivity and risk
- In riskier markets, traders often care a lot about the exact repayment promise
Why long-term bonds move more than short-term ones
Once you know that bond prices and yields move in opposite directions, the next question is how much they move.
The biggest part of the answer is time.
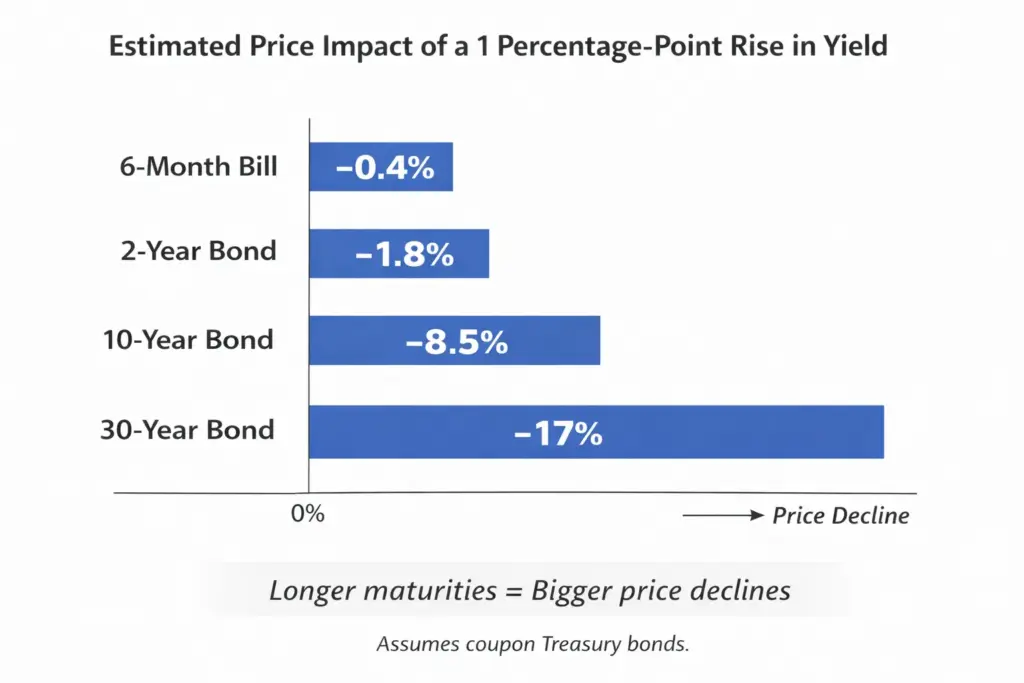
A bond that matures very soon usually does not move much in price. If you are only a few months away from getting your money back, there is only so much damage or benefit a change in market yields can do. Most of the bond’s value is tied to cash you will receive quite soon.
A bond that matures many years from now is different. With a 10-year or 30-year bond, much more of what you are buying lies further out in the future. If market yields move, the value investors place on those distant payments can change quite a lot. That is why long-dated bonds usually see much larger price swings than short-dated ones.
A practical way to think about it is this: a short-term bond is mostly about getting your money back soon. A long-term bond is more exposed to changes in the market’s view of interest rates, inflation and the economy over many years. The longer the wait, the more sensitive the price tends to be.
This is where the term duration comes in. Duration is a measure of interest-rate sensitivity. In plain English, it tells you how sharply a bond’s price is likely to react when yields move. Higher duration means bigger price swings. Lower duration means smaller ones.
For most readers, maturity is the main thing to remember. A 30-year government bond will usually have much higher duration than a 2-year government bond, so it will usually be much more volatile when yields change.
Coupon also plays a role, but it is easier to understand once the basic idea is clear. A bond with a higher coupon gives you more of your cash back earlier through larger interest payments along the way. A bond with a lower coupon leaves more of the value tied up in the final payment at maturity. That makes the lower-coupon bond a bit more sensitive, all else equal, because more of the value is still sitting further out in the future.
That does not mean a high-coupon bond is automatically safer in the everyday sense, or that a low-coupon bond is riskier in a credit sense. Those are different questions. Here we are only talking about interest-rate sensitivity: how much the market price moves when yields change.
So if you compare two bonds from the same issuer with the same maturity, the lower-coupon one will usually have slightly higher duration. But if you compare a 2-year bond with a 30-year bond, maturity overwhelms everything else. The 30-year bond will normally be far more sensitive, even if its coupon is higher.
That is why the long end of the bond market can become so lively during periods of stress. When markets start changing their view on inflation, central banks or government borrowing, the longest-dated bonds often move the most.
A simple way to think about it
- Short maturity: less time left, usually smaller price swings
- Long maturity: more time left, usually larger price swings
- Higher duration: more sensitivity to changes in yield
- Lower duration: less sensitivity to changes in yield
What is DV01?
DV01 is a standard market measure of rate sensitivity. It shows how much a bond’s price is expected to change for a 1 basis point move in yield, with 1 basis point = 0.01 percentage points.
A bond with a larger DV01 will move more in price for a given change in yield than a bond with a smaller DV01.
What is convexity?
Duration gives you a first estimate of how much a bond price may move when yields change. Convexity explains why that estimate is only approximate, especially when yields move a lot.
The reason comes from how a bond price is built. A bond is a set of fixed future payments: coupons along the way and principal at the end. To work out what those future payments are worth today, the market compares them with what investors can earn elsewhere at the time. If new bonds, savings rates or other relatively safe investments offer better returns, an older bond with a lower fixed coupon becomes less attractive unless its price falls. If interest rates are expected to fall and that old coupon suddenly looks generous, buyers may be willing to pay more for it.
This is not because the coupon has changed. The coupon is still the coupon. What changes is the market price of the right to receive those fixed payments. A bond paying a fixed 6% coupon may look ordinary when similar new bonds also pay around 6%. But if the economy slows and investors expect several rate cuts, that same 6% coupon can become more valuable. Buyers bid up the bond price, and its yield falls. If the opposite happens and newer bonds offer much higher yields, the old bond has to fall in price to compete.
In market language, this is when you may hear that a bond is trading at a premium or a discount to par. Par is the bond’s face value, usually the amount due back at maturity. A bond trading above that level is at a premium; a bond trading below it is at a discount.
Payments due soon are not very exposed to changes in the going market rate. Payments due many years from now are much more exposed, because investors are comparing them with alternatives over a much longer period. That is why long-dated bonds are more volatile than short-dated bonds.
Convexity is the next wrinkle. Duration gives you a quick straight-line estimate of that sensitivity, and that estimate works reasonably well for small yield moves. But as yields move further, the bond’s sensitivity changes too. The price path bends rather than following the same straight line forever. That is where the word convexity comes from: convex and concave are just terms for curves that bend one way or the other. In ordinary bond talk, convexity is the adjustment for that bend.
For most ordinary government bonds, that bend is helpful to the holder. A large fall in yields can lift the bond’s price by more than the simple duration estimate suggests. A large rise in yields can push the price down by a little less than that same estimate suggests.
Some bonds behave differently. Mortgage bonds and callable bonds can have negative convexity because borrowers may repay early when rates fall. That cuts off some of the investor’s upside just when the bond would otherwise become more valuable.
For most readers, the practical point is enough: duration tells you the first-order interest-rate risk. Convexity tells you why large yield moves can make the real price move differ from the simple estimate.
What the yield curve is and why markets obsess over it
Once you move beyond a single bond, one of the first charts you will keep seeing is the yield curve.
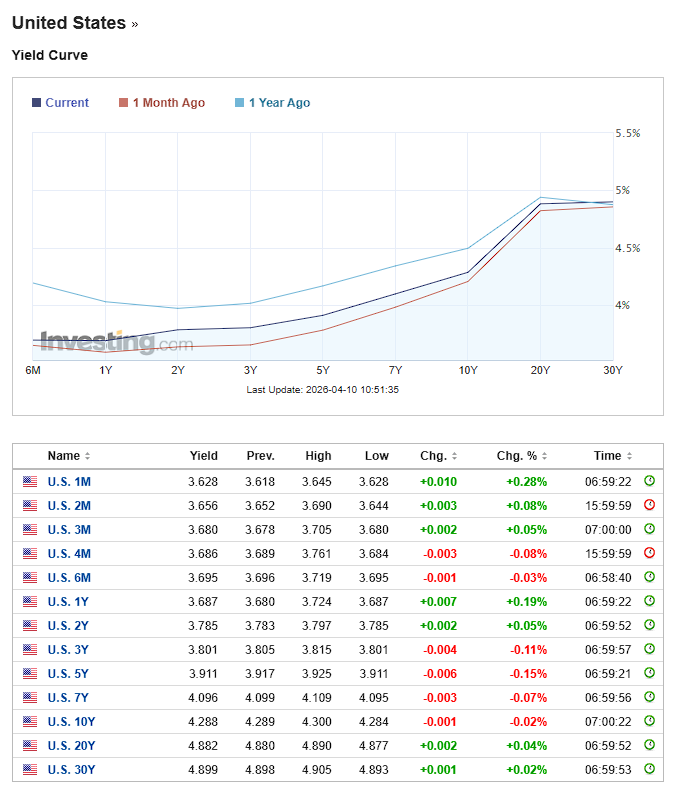
A yield curve is simply a line that plots the yields on bonds from the same issuer across different maturities at a single point in time. So instead of looking only at the 2-year Treasury yield or the 10-year gilt yield, you look at the whole set together: 3-month, 2-year, 5-year, 10-year, 30-year and so on. Put those on one chart and you have a yield curve.
The reason people care so much about it is that the curve gives you more information than any one yield on its own. A single yield tells you the return available on one bond. The curve gives you a picture of how the market is pricing time, interest rates, inflation and uncertainty.
In a normal environment, longer-dated bonds tend to yield more than shorter-dated ones. That gives you an upward-sloping curve. Investors usually want some extra return for tying money up for longer, and for taking the risk that inflation or interest rates might move against them over time.
Sometimes the curve flattens. That means the gap between short-term and long-term yields gets smaller. Sometimes it inverts, which means short-term yields rise above long-term yields. That is when people start talking about recession signals.
The logic is not mystical. If short-term yields are above long-term yields, the market is often saying that interest rates are high now but may not stay that high. In other words, investors think central banks may end up cutting rates later, usually because growth is expected to slow or inflation is expected to come under control.
That is why an inverted curve gets so much attention. It is not a fortune-telling machine, and it does not tell you exactly when anything will happen, but it does show that the market thinks the current level of short-term rates may not last.
A simple way to break the curve into parts is to think of the front end and the long end.
The front end means shorter maturities, usually out to around two years. These yields are heavily influenced by what investors think the central bank is going to do next. If traders start expecting more rate cuts, front-end yields often fall quickly. If they start worrying that inflation will stay stubborn, front-end yields may rise.
The long end means longer maturities such as 10-year and 30-year bonds. These yields are influenced by the expected path of interest rates too, but they also reflect longer-run inflation worries, government borrowing needs, investor demand and general confidence in the economic outlook. That is one reason the long end can behave differently from the short end.
This is also why people talk about the curve steepening or flattening. A steepening curve means the gap between short and long yields is widening. A flattening curve means that gap is narrowing. But even here, it helps to be careful. A curve can steepen because long yields are rising, which might reflect inflation concerns or heavier bond supply. It can also steepen because short yields are falling, which might reflect expectations of rate cuts. The shape changes can look similar on a chart while telling very different stories underneath.
For a new reader, the easiest way to use the curve is not to try to read every twist and turn. Just start with three questions.
First, is the curve upward sloping, flat or inverted?
Second, are short-term yields moving more than long-term yields, or the other way around?
Third, does the move seem to be about central-bank policy, inflation fears, growth worries or government borrowing?
If you can answer those three questions, you are already reading bond-market news more clearly than most people who only glance at the 10-year yield and move on.
A simple way to think about the yield curve
- Upward-sloping curve: longer bonds yield more than shorter ones
- Flat curve: there is little difference between short and long yields
- Inverted curve: short-term yields are above long-term yields
- Steepening: the gap between short and long yields gets bigger
- Flattening: the gap gets smaller
A few curve terms you will keep seeing
Market coverage often adds another label to moves in the yield curve: bull or bear.
In bond-market language, a bullish move usually means yields are falling and bond prices are rising. A bearish move means yields are rising and bond prices are falling.
Put that together with steepening and flattening, and you get four common phrases:
- Bull steepening: yields are falling, but short-term yields are falling faster than long-term yields
- Bear steepening: yields are rising, but long-term yields are rising faster than short-term yields
- Bull flattening: yields are falling, but long-term yields are falling faster than short-term yields
- Bear flattening: yields are rising, but short-term yields are rising faster than long-term yields
That sounds more technical than it really is. It is just a way of saying two things at once: whether yields are going up or down overall, and which part of the curve is moving more.
A few rough rules help. Bear flattening often shows up when markets are pricing more central-bank tightening, because short-dated yields react strongly to expected policy rates. Bull steepening often appears when markets are pricing rate cuts, because short-dated yields fall quickly as traders bring forward easier policy. Those are not iron laws, but they are common patterns.
You may also come across the phrase convexity-related hedging. This usually appears when long-dated yields are moving quickly and traders are trying to explain why the move is feeding on itself.
The plain-English version is that some investors, especially those exposed to long-duration assets such as pension funds, hedge their interest-rate risk dynamically. When yields move sharply, the sensitivity of those positions can change, which forces extra buying or selling of bonds or interest-rate derivatives to keep hedges in line. That extra activity can amplify the original move. You do not need the maths to understand the basic point: some market participants are not trading because they have a fresh view on inflation or growth; they are trading because the mechanics of their hedges are forcing them to.
A related bit of jargon appears in very short-term interest-rate markets. Traders sometimes talk about the white, red, green or blue packs of futures. This is a shorthand for groups of quarterly contracts further out along the expected path of policy rates.
The exact colour system depends on the market and the screen, but the basic idea is simple. The nearest contracts reflect expectations for the next few central-bank meetings. The later colour “packs” reflect expectations further into the future. So if you read that “reds and greens rallied”, it usually means traders pushed down expected policy rates not just in the next few months, but further out as well.
For a new reader, the useful translation is this:
- front contracts or whites: what the market thinks may happen soon
- later packs such as reds or greens: what the market thinks may happen after that
- a move across all packs: a broader repricing of the rate outlook
- a move only in the front contracts: a more immediate policy repricing
These are the kinds of terms that can make daily bond coverage sound more forbidding than it really is. Most of the time they are just compact ways of describing where yields moved, which maturities moved most, and whether hedging flows added fuel to the move.
Quick recap: curve terms
Bull flattening
Yields fall, with long-dated yields falling more than short-dated yields.
Bear flattening
Yields rise, with short-dated yields rising more than long-dated yields.
Bull steepening
Yields fall, with short-dated yields falling more than long-dated yields.
Bear steepening
Yields rise, with long-dated yields rising more than short-dated yields.
Convexity hedging
Extra buying or selling caused by the changing interest-rate sensitivity of existing positions.
Colour packs
Trader shorthand for groups of short-rate futures contracts at different points along the expected path of policy rates.
Carry, basis risk and term premium in plain English
Three more bond-market phrases are worth knowing: carry, basis risk and term premium. They sound technical, but the ideas are more ordinary than the language suggests.
Carry is the cost or benefit of holding something over time. A commodity example makes the idea easier. Imagine an oil trader buys crude today because they think they can sell it later at a higher price. While they wait, they may have to pay for storage, insurance, financing and even a tanker if the oil is being held at sea. Those running costs are part of the cost of carry. The future sale price needs to be high enough to make the wait worthwhile.
In bonds, carry usually means what you earn from holding the bond after allowing for the cost of financing it. The coupon helps you. Borrowing money to hold the bond, or giving up a better return elsewhere, can hurt you. If the income from the bond is comfortably above the cost of holding it, traders may say the position has positive carry. If the position costs money while you wait, it has negative carry.
There is also a “roll” element in some bond trades. A bond does not stand still. A 10-year bond gradually becomes a 9-year bond, then an 8-year bond, and so on. If the yield curve is shaped in a way that lets the bond move toward a lower-yielding part of the curve as it ages, its price may benefit even if nothing dramatic happens. That is the basic idea behind rolldown. It is not free money, but it is one reason bond investors care so much about the shape of the yield curve.
Basis risk means your hedge is close to the thing you are trying to protect, but not a perfect match. Suppose you own one type of government bond and hedge it with a bond future based on a slightly different basket of bonds. The hedge may move in the right general direction, but not by exactly the same amount. The gap between “roughly protected” and “perfectly protected” is basis risk.
The same idea appears outside bonds too. A company with floating-rate debt might use an interest-rate swap to reduce the risk of rising borrowing costs. A swap is just a contract where two sides exchange one type of interest payment for another, often fixed-rate payments for floating-rate payments. That can reduce the main interest-rate risk, but it may not match the company’s real borrowing costs exactly. Again, the mismatch is basis risk.
Term premium is the extra return investors may want for lending for a long time rather than lending for a short time and rolling the money over later. A 30-year bond is not just a bet on where central-bank rates will be next month. The buyer is locking money away through many possible governments, recessions, inflation scares, debt scares and policy mistakes. Term premium is the market’s way of charging something for that uncertainty.
Government bonds: the benchmark market everything else is built on
When people talk about “the bond market” in the news, they often mean government bonds first.
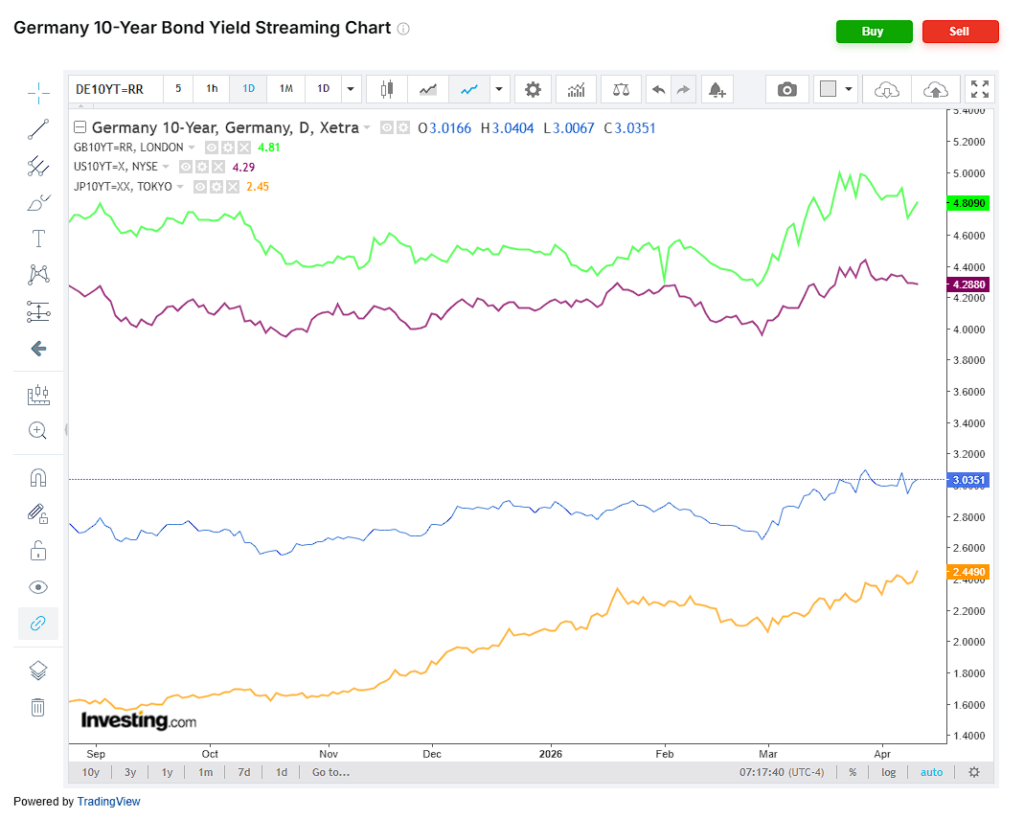
That is partly because government bond markets are large and heavily traded, but also because they sit at the centre of the wider financial system. Yields on U.S. Treasuries, UK gilts, German Bunds and Japanese government bonds help set the reference point for borrowing costs across their own economies. Mortgage rates, corporate bond yields, bank funding costs and all sorts of financial models take their cue from these markets.
If you want a rough rule of thumb, government bonds issued by large developed countries are usually treated as the closest thing to a benchmark “risk-free” asset in that currency. That does not mean their prices cannot move sharply, or that every government bond is equally safe. It means they are the starting point. Once you know the yield on a government bond, you can begin to judge how much extra return investors are demanding to lend to a company, a weaker sovereign borrower or a bank issuing more complex debt.
The U.S. Treasury market is the most important example. It is the deepest government bond market in the world and acts as the global reference point for everything from mortgage pricing to corporate finance to the value of the dollar itself. When Treasury yields move sharply, the effects tend to spread well beyond the United States. That is one reason people everywhere end up watching the U.S. 10-year yield, even if they never plan to buy a Treasury themselves.
Other benchmark markets matter for similar reasons closer to home. In Britain, gilt yields shape the cost of government borrowing and influence everything from pensions to mortgage pricing. In the euro area, German Bunds are often treated as the core benchmark, with other sovereign yields (such as Italian BTPs or French OATs) judged partly by the spread over Bunds. In Japan, government bond yields spent years pinned unusually low by Bank of Japan policy, which made every move higher feel especially significant.
Government bond yields can rise or fall for several reasons at once. Inflation expectations are important. Central-bank policy matters. Economic growth ties into those. Other reasons are practical things such as how much debt a government plans to issue, what maturities it chooses to issue, and whether central banks are buying bonds, holding steady or selling them back into the market through quantitative tightening.
That last point is important because it helps explain why yields are not just a neat readout of economic opinion. Bond markets are markets in the old-fashioned sense as well: supply, demand, positioning and liquidity all matter. A government planning heavy issuance can put pressure on yields. A central bank stepping back from bond purchases can do the same. Strong demand from pension funds, insurers or overseas reserve managers can pull in the opposite direction.
This is one reason comparisons across countries need a bit of care. It is tempting to look at a UK gilt yield, a U.S. Treasury yield and a German Bund yield and treat them as a simple league table of fiscal virtue or market confidence. Sometimes there is a grain of truth in that, but often there is much more going on. Different countries have different inflation histories, different central banks, different investor bases and different growth outlooks. Japan is a good example. Its yields are still low by international standards, but even modest moves can be a major story because the country spent so long in an ultra-low-rate world.
For a new reader, the most useful habit is to see government bond yields as the foundation stones of the broader market. They are where policy expectations, inflation fears, economic confidence and borrowing needs come together first. Once those benchmark yields move, everything built on top of them has to adjust.
One common shortcut is to compare a government bond yield with the earnings yield on a stock index. Earnings yield is the index’s earnings divided by its price; it is roughly the inverse of the price/earnings ratio. The comparison can be useful as a quick “what else could investors earn?” check, but it should not be treated as a clean valuation law. A bond coupon is contractual. Company earnings are not. Earnings can grow, shrink, disappear in a recession or rise with inflation. Bond cash flows are usually fixed unless the structure says otherwise. So a Treasury yield and an equity earnings yield are not the same kind of number, even if market commentary often puts them side by side.
Quick recap: government bonds
- Government bonds are the main benchmark markets in each currency
- Treasuries, gilts, Bunds and JGBs are the best-known examples
- They help set the base level for mortgage rates, corporate borrowing costs and other market prices
- Their yields move with inflation expectations, central-bank policy, growth and bond supply
- They are often treated as the starting point for pricing risk elsewhere in the market
Nominal yields, real yields and inflation-linked bonds
Most bond headlines quote nominal yields. That simply means the yield before adjusting for inflation. If a bond yields 5% and inflation is expected to be 3%, the rough real yield is about 2%. The real yield is the return after allowing for the expected loss of purchasing power – which inflation eats away at.
The difference between nominal and real is important. A high nominal yield is not always generous if inflation is also high. A lower nominal yield can still be attractive if inflation is expected to fall sharply. This is why bond markets obsess over inflation expectations, not just the latest central-bank rate.
Inflation-linked bonds try to deal with this problem directly. In the United States they are called TIPS, or Treasury Inflation-Protected Securities. In the UK they are usually called index-linked gilts, or linkers. The exact mechanics vary, but the broad idea is that the bond’s payments are linked to an inflation index, so the investor gets some protection if prices rise.
These bonds are useful, but they are still market prices, not inflation truth machines. Their prices can be pushed around by supply, demand, liquidity, tax treatment, pension-fund buying and the details of how the inflation adjustment works. So when commentators use TIPS or linkers to talk about “real yields”, the reading is useful, but it is not pure.
You may also hear about breakeven inflation. This is the rough inflation rate implied by comparing a normal government bond with an inflation-linked bond of a similar maturity. If a regular 10-year Treasury yields 5% and a 10-year TIPS yield is 2%, the simple breakeven inflation rate is about 3%. In plain English, that is roughly the inflation rate at which the two bonds would work out the same before allowing for market distortions.
The important caveat is that breakevens are not the same as a clean inflation forecast. They can include liquidity differences, risk premia and technical buying or selling pressure. They are useful market clues, not a promise that inflation will land exactly there.
For a general reader, the hierarchy is simple. Nominal yield is the headline yield before inflation. Real yield is the inflation-adjusted yield. Inflation-linked bonds try to protect investors from inflation. Breakeven inflation is the market-implied inflation rate you get by comparing ordinary bonds with inflation-linked bonds. All four are useful, but none should be read in isolation.
Corporate bonds and credit spreads: where default risk enters the picture
So far, most of the examples in this guide have used government bonds. That keeps the mechanics simple. Once you move into corporate bonds, the question widens. Interest rates still matter, but so does the borrower’s ability to stay strong enough to repay you in full.
A corporate bond is still a tradable loan. The basic structure is familiar enough: a company borrows money, pays interest, and promises to repay the principal at maturity. The difference is that investors are no longer lending to a sovereign issuer with its own tax base and, in some cases, its own central bank standing behind the currency. They are lending to a business that can prosper, struggle, refinance at a bad moment, or in the worst case default. That is why corporate bonds usually offer a higher yield than government bonds of similar maturity. Investors want extra compensation for taking that extra risk.
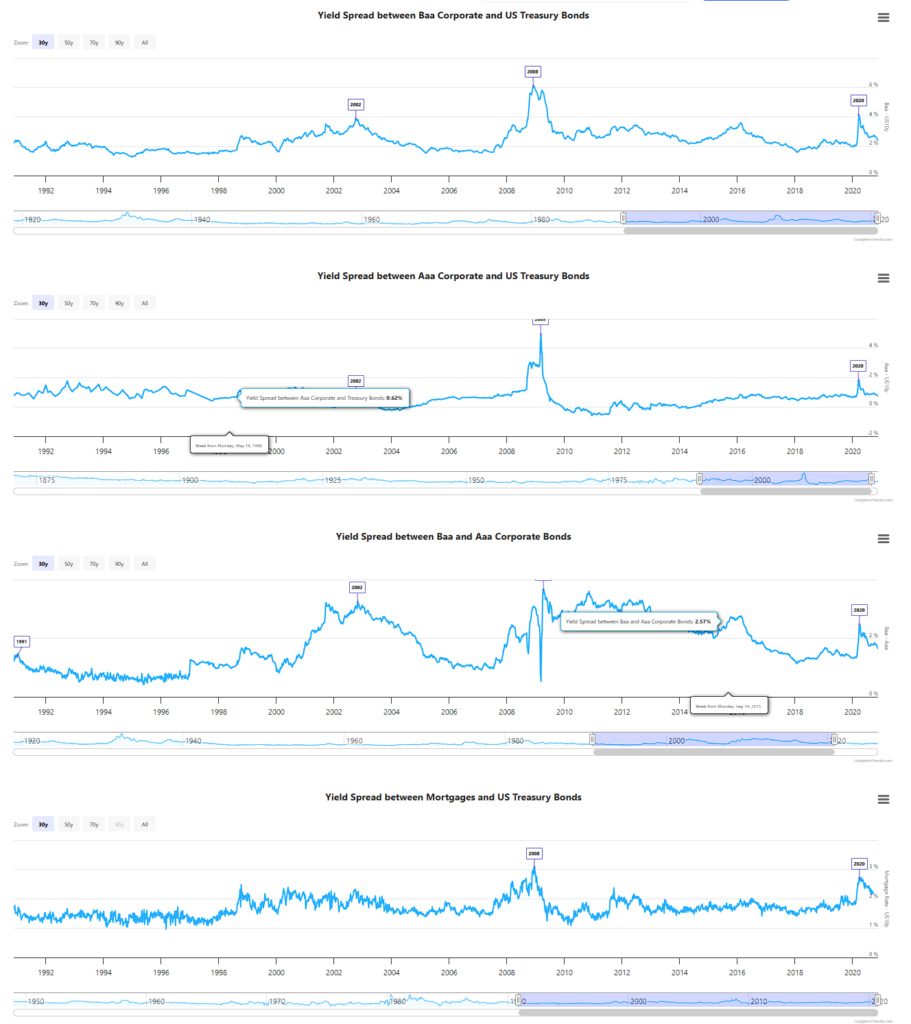
That extra yield is known as the credit spread. In simple terms, it is the gap between the yield on a corporate bond and the yield on a government bond that is treated as the benchmark. If a 5-year government bond yields 3% and a 5-year company bond yields 5%, the spread is roughly 2 percentage points, or 200 basis points. The spread is the market’s way of pricing default risk, refinancing risk, liquidity risk and general uncertainty around the borrower.
This is where readers often hear the market split into two broad camps: investment-grade bonds and high-yield bonds. Investment-grade means the borrower is still regarded as relatively strong. High-yield means the borrower is riskier and has to pay more to borrow. High-yield bonds are also the ones many readers will know by the older label: junk bonds. The term sounds theatrical, but it simply refers to bonds rated below investment grade. They are not automatically worthless and they are not always issued by failing companies. They just sit further down the quality ladder and carry a higher probability of trouble than investment-grade debt.
“Junk bonds” became famous well before most retail readers ever looked at a bond screen. In the 1980s, Michael Milken helped build a huge market in non-investment-grade debt at Drexel Burnham Lambert, arguing that these bonds were often neglected rather than irrationally dangerous, and using them to finance takeovers, leveraged buyouts and a great deal of Wall Street drama. Milken’s junk-bond operations fuelled many of the decade’s corporate takeovers. Later, he pleaded guilty to securities-fraud charges, served prison time, paid large fines and was permanently barred from the securities business; he was pardoned in 2020.
If you want the rollercoaster version of that era, Den of Thieves by James B. Stewart is a book I highly recommend despite its slow start. It’s the story of the insider-trading scandal that nearly destroyed Wall Street, centred on figures including Milken and Ivan Boesky. It is worth reading because it captures how high-yield finance became tangled up with ambition, leverage, crime and myth-making.
Milken’s reputation today is a strange mix of old scandal and later rehabilitation. The conviction and the Drexel collapse remain part of the story, but so does the later chapter: the Milken Institute presents him as a major figure in philanthropy and public-policy convening, alongside his later charitable and medical-research work. That does not erase the past. It does explain why his name still comes up with a mix of condemnation, fascination and respect, depending on who is doing the talking.
Back in the present, the important point is simpler. Corporate bond investors are always weighing two things at once. First, the same interest-rate risk that affects government bonds: if market yields rise, bond prices fall. Second, issuer-specific risk: if the market becomes more worried about the company itself, the credit spread can widen, pushing the yield higher still. That is why corporate bonds can sometimes move more sharply than government bonds even when the broader rates backdrop has not changed very much.
This is also why credit spreads are so useful to watch. Government bond yields tell you what the market thinks about inflation, growth and central banks. Credit spreads tell you how comfortable the market feels lending to businesses on top of that. If spreads are narrow, investors are relaxed. If spreads start widening quickly, it usually means confidence is deteriorating and investors want more compensation for taking corporate risk.
The headline terms are easier than they first appear. Investment grade means stronger credit quality. High yield or junk means weaker credit quality and a higher promised return. Spread widening means the market is getting more nervous. Spread tightening means it is getting more comfortable. Once you have that translation in your head, a lot of daily market coverage becomes far easier to read.
Quick recap: corporate bonds and spreads
- Corporate bonds are loans made to companies rather than governments.
- They usually yield more than government bonds because investors take extra risk.
- That extra yield is the credit spread.
- Investment-grade bonds are seen as stronger credits.
- High-yield or junk bonds are riskier and therefore pay more.
- If spreads widen, the market is getting more cautious about company risk.
- If spreads tighten, the market is getting more comfortable.
Not all bonds sit in the same place: senior debt, subordinated debt and AT1s
By this point, “bond” may already sound like too broad a word.
That is because it is. Two securities can both be called bonds and still behave very differently when the borrower gets into trouble. Some sit high up the repayment queue. Others are designed to absorb losses earlier. That difference matters a great deal, and it became much harder for casual readers to ignore after the Credit Suisse rescue in 2023.
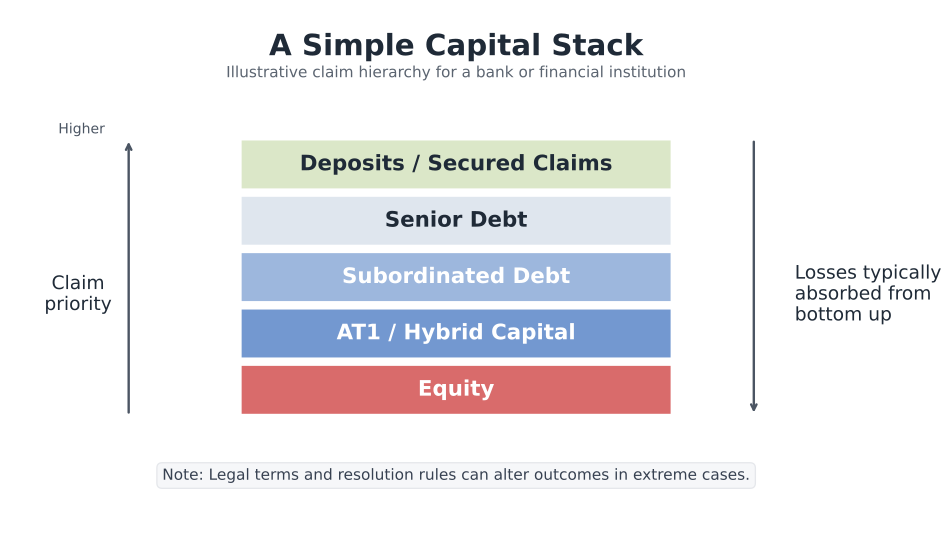
The basic idea is called the capital structure. When a company or bank funds itself, it does not usually rely on just one type of money. There may be ordinary shares, preferred shares, bank loans, senior bonds, subordinated bonds and more specialised instruments in between. If the business runs into serious trouble, those layers do not all get treated the same way. Some investors are meant to be repaid before others. The higher up you are in the structure, the better your claim tends to be. The further down you go, the more risk you are taking in exchange for the chance of a higher return.
At the safer end sits senior debt. As the name suggests, senior bondholders usually rank ahead of more junior creditors if assets are being divided up. Beneath that you may find subordinated debt, which ranks lower and therefore carries more risk. In banks, things become more specialised again because regulators want institutions to have layers of loss-absorbing capital between ordinary depositors and outright collapse.
That is where AT1s, or Additional Tier 1 bonds, come in. These instruments are often described as bonds, but they are really a hybrid between debt and equity. They usually pay high coupons, but they are also built to take pain in a crisis. Depending on their terms, they can be written down, converted into equity, or otherwise forced to absorb losses if a bank’s capital position deteriorates badly enough. In ordinary times, they can look like juicy income instruments. In stressed times, they can behave much more like a shock absorber.
The reason so many people now know the term is Credit Suisse. When the Swiss authorities pushed through the UBS rescue in March 2023, about CHF 16 billion of Credit Suisse AT1 bonds were written down to zero. Shareholders, who in a normal corporate hierarchy would usually expect to rank below bondholders, still received some value in UBS stock. That shocked many investors and triggered a long legal and regulatory afterlife. The official argument was that the specific terms of those AT1 instruments and the emergency powers used in the rescue allowed it. Investors who had assumed they were buying something bond-like in the usual sense discovered that the small print and the legal regime mattered far more than they had appreciated.
That episode is a useful warning for new readers. Yield on its own is never the whole story. A bond that offers much more income than ordinary senior debt is usually doing so for a reason. Sometimes that reason is simply weaker credit quality. Sometimes it is because the bond sits lower in the capital structure. Sometimes it is because it contains terms that can radically change the outcome in a crisis.
This does not mean AT1s are fake bonds or that they never have a place in portfolios. It means they should not be discussed as though all bonds belong in one neat bucket. A short-dated senior government bond, a long-dated high-yield company bond and a perpetual bank AT1 may all appear under the broad label of fixed income, but they expose investors to very different kinds of risk.
For a general reader, the practical lesson is straightforward. When you see a bond offering a notably higher yield than the rest of the market, ask what extra risk is sitting behind that yield. Is it a weaker borrower? A longer maturity? Lower ranking in the repayment queue? A clause that allows conversion into shares or a write-down in stress? Quite often, the answer is some combination of all four.
Financial news will often mention where a bond ranks, not only who issued it. “Senior unsecured”, “subordinated”, “Tier 2” and “AT1” are not decorative labels. They are clues to what might happen if the borrower gets into difficulty.
Quick recap: capital structure and AT1s
- Not all bonds rank equally if an issuer gets into trouble.
- Senior debt usually sits higher in the repayment queue.
- Subordinated debt sits lower and takes more risk.
- AT1s are bank capital instruments designed to absorb losses in a crisis.
- A higher yield can reflect not just more default risk, but also lower ranking or more complex terms.
- In stressed situations, the legal terms of the instrument matter as much as the headline yield.
How government borrowing, bond auctions and central banks move the market
It is tempting to think of bond yields as a pure expression of market opinion. Inflation goes up, yields rise. Growth weakens, yields fall. A central bank signals cuts, the front end rallies. That is all true as far as it goes, but it leaves out something important: bond markets are also affected by plain old supply and demand.
Governments do not just have outstanding debt sitting there passively. They keep borrowing. Old bonds mature, deficits need funding, and debt managers have to decide what mix of short, medium and long maturities to issue. That means the bond market is constantly absorbing new supply.
When that supply looks heavy, yields can come under upward pressure. The logic is not mysterious. If the market is being asked to take down a large amount of new debt, investors may demand a better yield to do so. If the supply is lighter than expected, or concentrated in maturities that investors particularly want, yields can ease.
That is one reason bond auctions matter. Governments generally sell debt through regular auctions, and those auctions give the market a real-time test of demand. If an auction is well received, the issuer may be able to borrow at yields close to where the market was already trading. If demand is weak, the debt may need to clear at a higher yield than expected, which can push yields higher more broadly. Traders then study the result for clues about how easily the market absorbed the new debt.
One of the first numbers they look at is the bid-to-cover ratio. This measures total bids relative to the amount of bonds on offer. If a government sells $40 billion of bonds and receives $100 billion of bids, the bid-to-cover ratio is 2.5. In plain English, demand was two and a half times the amount available. A higher ratio usually suggests stronger demand. A lower one can point to a softer reception.
Another closely watched detail is the tail. This is the difference between where the auction clears and where the market had been trading just before the result. If the bond clears at a higher yield than expected, the auction is said to have tailed. That usually suggests buyers wanted a little more compensation than the market had assumed. A small tail is common enough. A large one tends to get attention.
Auction reports also break down who bought the bonds. In U.S. Treasury coverage, for example, traders often focus on direct bidders, indirect bidders and dealers.
Direct bidders are investors bidding for their own accounts. Indirect bidders often include foreign central banks, reserve managers and large institutional investors bidding through intermediaries. Dealers are the banks obliged to help distribute the issue and make markets afterwards. If direct and indirect demand is weak, dealers may be left taking a larger share themselves, which can signal underwhelming appetite.
The maturity of the bonds being sold matters too. Heavy issuance of long-dated bonds can put more pressure on the long end of the curve. A shift toward shorter-dated borrowing can sometimes relieve that pressure. This is one reason markets pay close attention not just to how much a government plans to borrow, but how it plans to borrow it.
Central banks influence this process in two ways.
The first is obvious: they set short-term policy rates, which anchor the front end of the curve.
The second is through their balance sheets. During years of quantitative easing, or QE, central banks bought large quantities of government bonds. That added a powerful source of demand and helped keep yields lower than they might otherwise have been. Under quantitative tightening, or QT, the reverse happens. Central banks allow bonds to mature without replacement or actively sell holdings back into the market. That means private investors have to absorb more supply.
This is why bond yields are not driven only by economic theory or central-bank speeches. They are also shaped by plumbing. A weak growth number might pull yields lower, while heavy issuance or ongoing QT pushes the other way. A decent inflation report might help the market rally, only for a poor auction to interrupt it. In practice, bond moves often reflect both macro views and market mechanics at once.
The UK gilt market offers a good example. Yields there have been influenced not only by inflation and Bank of England policy, but also by debt issuance plans, the mix between short and long maturities, and the impact of the Bank shrinking its gilt holdings. If you want the deeper version of that story, our article on the Bank of England’s bond-sale strategy looks at the liquidity side in more detail, and our LDI guide explains how sharp gilt moves can create stress in leveraged pension strategies.
The same principle applies in the United States. Treasury auctions are watched so closely because Treasuries sit at the core of global finance. A disappointing auction does not automatically signal disaster, but it can tell you that buyers want a little more yield before stepping in. Multiply that across repeated issuance, changing policy expectations and shifting central-bank demand, and you begin to see why bond markets can feel so sensitive even when the economic story seems straightforward.
Quick recap: auctions, QE and QT
- Governments constantly issue new debt to fund deficits and refinance maturing bonds.
- Bond auctions are live tests of investor demand.
- Bid-to-cover shows how much demand appeared relative to the amount sold.
- A tail means the auction cleared at a higher yield than expected.
- Direct bidders, indirect bidders and dealers help show who actually bought the bonds.
- Heavy issuance can put upward pressure on yields, especially in the maturities being sold.
- QE adds central-bank demand; QT removes it.
- Bond yields are shaped by both macroeconomic views and market mechanics.
How to decode bond-market headlines
By the time you have read this far, most bond-market coverage should already feel less alien. Even so, daily headlines still tend to compress a lot of information into a few bits of shorthand. That is fine if you spend your day staring at rates screens. It is less fine if you are just trying to work out why yields moved and whether it matters.
A good way to approach bond headlines is to break them into three layers.
The first layer is the simplest: which part of the market moved? Was it short-dated government bonds, long-dated bonds, corporate spreads, or something more specialised such as AT1s? A move in the 2-year Treasury yield usually tells a different story from a move in the 30-year yield. A move in high-yield spreads tells a different story again.
The second layer is: what type of force is driving it? In broad terms, bond moves usually come from one or more of four places. The market may be repricing central-bank policy. It may be reacting to inflation or growth data. It may be digesting supply, auctions or balance-sheet changes such as QT. Or it may be responding to a credit event, a legal shock or a broader risk-off move.
The third layer is: is the move being amplified by market mechanics? This is where some of the stranger phrases come in. You might read that convexity hedging added fuel to the sell-off, or that a poor auction result pushed yields through a key level, or that front-end futures rallied hard while the long end lagged. That does not always mean there is a new grand macro story. Sometimes it just means a move started for one reason and then gathered speed because of hedging, positioning or weak liquidity.
Once you start reading headlines through those three layers, the jargon becomes much easier to translate.
Take a headline such as: “Treasuries weaker after soft 10-year auction, indirect demand light, curve bear-steepens.” That sounds dense, but it can be unpacked fairly quickly. “Treasuries weaker” means prices fell and yields rose. A “soft auction” suggests demand was not especially strong. “Indirect demand light” hints that large institutional or overseas buyers were less aggressive than usual. “Bear-steepens” means yields rose overall, with longer-dated yields rising faster than shorter-dated ones.
Or take a line such as: “Front-end rallies as traders price more cuts, reds and greens outperform.” The first part tells you the short end of the curve moved most strongly because the market now expects easier policy. The second part refers to those colour-coded packs of short-rate futures further along the expected path of policy rates. You do not need to memorise every detail of the colour system to understand the message. It simply means rate-cut expectations are no longer confined to the very nearest meetings.
You can use the same method on credit headlines. “High-yield spreads widen as recession fears grow” means the market is demanding more compensation to lend to riskier companies. “AT1s under pressure after court ruling” means investors are reassessing legal or structural risks in those bank capital instruments. “Gilts rally despite heavy supply” means buyers were willing to absorb new issuance, perhaps because inflation data softened or because yields had already become attractive.
This is one reason it helps not to become too attached to one-word explanations. Yields rarely move for just one reason. A market report may mention inflation, but the auction may have mattered too. It may mention central-bank rhetoric, but positioning could have amplified the reaction. The most useful habit is to read the headline, identify the part of the market in play, and then ask what combination of macro news and market mechanics is underneath it.
For readers who want to go a little further, some of the site’s existing articles make good follow-ons rather than detours. Our piece on liability-driven investment is useful if you want to understand how large gilt moves can feed into forced selling and pension stress. Our article on the Bank of England’s bond-sale strategy is the place to go if you want more on QT, liquidity and market functioning. And if short-end benchmarks such as SOFR and SONIA keep appearing in coverage, the overnight-rates and CFD funding pieces explain why those names matter outside specialist rates desks. For market impacting economic release fundamentals this article is not a bad place to start.
The main thing, though, is simpler. Bond-market headlines are usually not hiding some secret language. They are just using compressed terms for moves in yield, curve shape, credit risk and demand.
Quick recap: decoding bond headlines
- Start with which part of the market moved: short end, long end, credit or hybrids
- Then ask what drove it: policy, inflation, growth, supply or credit stress
- Then ask whether market mechanics amplified it: auctions, hedging, liquidity or positioning
- Bearish in bonds means yields up, prices down
- Bullish in bonds means yields down, prices up
- A lot of scary-sounding bond jargon is just shorthand for those basic ideas
What to watch on one screen
If you want to keep an eye on bond markets without disappearing into a terminal all day, you do not need to follow every maturity, every auction and every spread product. A small dashboard is enough to tell you most of what matters.
For U.S. markets, the starting point is usually the 2-year, 5-year, 10-year and 30-year Treasury yields. Those four points give you a quick sense of where pressure is building. The 2-year tends to be most sensitive to expectations for Federal Reserve policy over the next several meetings. The 5-year often captures the middle ground between near-term policy and the broader economic path. The 10-year is the best-known benchmark and tends to matter most for mortgages, valuation models and global market sentiment. The 30-year tells you more about the very long end, including inflation worries, debt-supply concerns and demand from pensions and insurers.
Many traders also watch the futures market rather than just the cash yields. In the United States, that usually means Treasury futures across the main parts of the curve, as well as short-rate contracts linked to expected policy rates such as SOFR futures. In Europe, the equivalent reference points often include the familiar Eurex government-bond futures: Schatz for the short end, Bobl for the medium sector, Bund for the 10-year area and Buxl for the long end. Traders watching euro rates more closely may also follow French OAT futures and Italian BTP futures, especially when concerns about spreads inside the euro area return.
You do not need to trade any of those contracts to get something useful from them. They tell you where pressure is appearing. If Bund futures are rallying while BTP futures are lagging, that may be a sign of stress or widening sovereign spreads in Europe. If SOFR futures are moving sharply while Treasury yields are calmer, the market may be repricing the path of central-bank policy more than long-term inflation or growth.
It also helps to keep one eye outside bonds themselves.
Oil matters because it can quickly alter inflation expectations and change how markets think about central banks. That is one reason war can hit bond markets so fast. A geopolitical shock that threatens energy supply can push crude higher, which then feeds into inflation fears, rate expectations and long-end yields. Even if the initial move is a classic rush into safe government bonds, that first reaction may not last if oil stays high and investors start worrying more about inflation than growth.
Gold is worth watching for a different reason. It often attracts safe-haven demand during geopolitical stress, but it can also react to real yields, dollar moves and inflation fears. When gold, oil and government bonds are all moving sharply together, the market is usually trying to sort out whether the dominant story is fear, inflation or both.
Foreign exchange matters too, especially the U.S. dollar, yen, Swiss franc and major pairs such as EUR/USD and USD/JPY. In periods of stress, a stronger dollar or yen can signal a defensive move in global markets. Currency weakness can also feed back into inflation concerns, particularly in countries that rely heavily on imported energy. (For more detail on foreign exchange markets check out our article on FX derivatives.)
That is why war really can change everything in markets, at least for a while. It does not just move one asset class. It can reshape the whole map at once: oil jumps, gold rallies, currencies shift, government bonds catch a safe-haven bid, then inflation worries push yields back up, while credit spreads and equities try to work out whether the shock will be short-lived or persistent. In calm periods, traders can separate these stories more neatly. In a geopolitical shock, they all arrive together.
For a reader trying to make sense of market coverage, the goal is not to monitor twenty screens. It is to follow a few linked signals and ask what story they are telling together.
A simple market dashboard
- U.S. 2-year yield: near-term central-bank expectations
- U.S. 10-year yield: the main benchmark for growth, inflation and risk sentiment
- U.S. 30-year yield: long-end inflation and debt-supply sensitivity
- 2s10s or 5s30s curve: how the shape of the curve is changing
- SOFR futures: where the market thinks policy rates are going
- Bund / Bobl / Schatz / Buxl futures: the same broad curve story in core euro markets
- OAT and BTP futures: useful when France or Italy-specific spread risk is in focus
- Investment-grade and high-yield spreads: how comfortable investors are with company risk
- Oil: inflation and geopolitical stress signal
- Gold: safe-haven and real-yield signal
- Major FX pairs: where defensive flows and inflation pressure may be building
Quick recap: market dashboard
War changes markets quickly because it can hit inflation, growth, currencies and risk appetite all at once.
You do not need to watch every bond to follow the market well.
The 2-year, 10-year and 30-year give a strong first read on the U.S. curve.
SOFR futures help show how policy-rate expectations are shifting.
In Europe, Schatz, Bobl, Bund and Buxl futures do something similar across the curve.
BTPs and OATs matter when euro-area spread risk becomes a story.
Oil, gold and FX often help explain why bonds are moving, especially in geopolitical shocks.
Final thoughts
Bond markets will always have more jargon than most people want. Duration, convexity, carry, basis risk and term premium are real concepts, not decorative trader language. But they all come back to a smaller set of questions: what cash flows are promised, when are they paid, how sensitive are they to changing yields, what extra risk is being taken, and what market mechanics might be pushing prices around today?
You do not need to become a bond mathematician to read the headlines better. If you understand the price-yield relationship, the yield curve, duration, convexity, credit spreads, supply and the difference between inflation expectations and real yields, you are already ahead of most casual market commentary and dare I say it the majority of institutional traders I have met.