
Updated May 2026: This RSI guide has been refreshed with clearer Wilder-smoothing notes, better divergence warnings, updated trading-signal explanations, and improved Python code guidance.

Introduction
The Relative Strength Index, or RSI, is one of the most widely used momentum indicators in trading. It measures the speed and size of recent closing-price moves and converts that information into an oscillator that moves between 0 and 100.
Most traders learn the simple version first: RSI above 70 is “overbought” and RSI below 30 is “oversold”. That shortcut is useful as a starting point, but it is also where many bad RSI trades begin. A strong market can stay overbought for longer than feels reasonable, and a weak market can stay oversold while price keeps falling.
RSI is more useful when it is treated as a momentum and market-condition tool. It can help identify overextended moves, trend strength, failed reversals, divergence, and moments when price is losing momentum.
This guide explains how RSI is calculated, why Wilder’s smoothing matters, how traders use RSI divergence and swing rejection patterns, where RSI signals can mislead you, and how to code the indicator in Python.
Key Takeaways
- RSI is a momentum oscillator developed by J. Welles Wilder.
- It measures the strength of recent closing-price gains relative to recent closing-price losses.
- Despite the name, RSI does not compare one security with another. It is not the same as traditional relative strength against an index.
- The standard RSI formula uses smoothed average gains and losses, commonly with a 14-period lookback.
- RSI above 70 is often called overbought and RSI below 30 is often called oversold, but interestingly CQG’s default levels are 75 and 25.
- Overbought does not automatically mean sell, and oversold does not automatically mean buy. In strong trends, RSI can remain extreme for long periods.
- RSI divergence can warn that momentum is weakening, but it should not be treated as a standalone trade signal.
- The Python section later in this guide shows how to calculate RSI using Wilder-style smoothing and compare it with a simple moving-average version.
Origins of the RSI Indicator
The Relative Strength Index was developed by J. Welles Wilder and introduced in his 1978 book New Concepts in Technical Trading Systems. Wilder also created several other well-known indicators, including ATR, the Directional Movement system and the Parabolic SAR.
RSI was designed to measure price momentum from a single market’s own closing-price history. This is important because the name can be misleading. RSI is not “relative strength” in the sense of comparing a stock with the S&P 500 or another benchmark. It is a momentum ratio based on recent gains and losses in one instrument.
Wilder’s original default period was 14, although traders often adjust the lookback depending on timeframe and market. A shorter RSI reacts faster but creates more noise. A longer RSI is smoother but slower.
Mathematical Construction
The RSI formula is:
RSI = 100 – [100 / (1 + RS)]
or to put it another way:
RSI = 100 - \frac{100}{1 + RS}RS is the ratio of average gains to average losses:
RS = Average Gain / Average Loss
RSI = 100 - \frac{100}{1 + RS}The important detail is how those average gains and losses are calculated.
First, calculate the change in closing price from one bar to the next.
If the change is positive, it counts as a gain. If the change is negative, its absolute value counts as a loss.
For the first RSI value, average gain and average loss are usually calculated over the lookback period. Wilder’s standard setting was 14 periods.
After that first calculation, Wilder used a smoothing method rather than a simple rolling average:
Average Gain = [(Previous Average Gain × 13) + Current Gain] / 14
Average\ Gain_t = \frac{(Average\ Gain_{t-1} \times 13) + Current\ Gain}{14}Average Loss = [(Previous Average Loss × 13) + Current Loss] / 14
Average\ Loss_t = \frac{(Average\ Loss_{t-1} \times 13) + Current\ Loss}{14}That smoothing process is why RSI from one charting platform can differ slightly from a quick spreadsheet version using a simple moving average.
In Python, this can be approximated with an exponentially weighted moving average using a smoothing factor equivalent to Wilder’s method. The code section later shows how to do this, and why it can look different from a simple rolling-average RSI.
Understanding the RSI Indicator
RSI moves between 0 and 100.
Readings above 70 are commonly described as overbought, while readings below 30 are commonly described as oversold. Those are the levels most retail traders know. Some professional platforms use different defaults; CQG, for example, uses 75 as its default overbought level and 25 as its default oversold level, with 50 as the centre line.
The 50 line matters because it often acts as a rough momentum divider. RSI above 50 suggests average gains are stronger than average losses. RSI below 50 suggests average losses are stronger than average gains.
The biggest RSI mistake is assuming that overbought means “sell now” and oversold means “buy now”. In a strong uptrend, RSI can stay overbought while price keeps rising. In a strong downtrend, RSI can stay oversold while price keeps falling.
So RSI is better read in context:
– in ranges, overbought and oversold signals can be useful;
– in trends, RSI extremes can show strength rather than immediate reversal;
– around the 50 line, RSI can help judge whether momentum is shifting;
– divergence can warn that momentum is weakening, but it does not guarantee a reversal.
Buy and Sell Signals
RSI can help identify trading opportunities, but it should not be used as a mechanical instruction to buy or sell.
Overbought and oversold signals
The classic interpretation is simple: RSI above 70 suggests overbought conditions, and RSI below 30 suggests oversold conditions. This can work best in range-bound markets where price repeatedly swings between support and resistance.
In strong trends, those same signals can be dangerous. A powerful uptrend may push RSI above 70 and keep it there. A powerful downtrend may keep RSI below 30. In those cases, the extreme RSI reading may be confirming momentum rather than warning of an immediate reversal.
RSI divergence
RSI divergence occurs when price and RSI stop confirming each other.
A bearish divergence forms when price makes a higher high, but RSI makes a lower high. That can suggest upside momentum is weakening.
A bullish divergence forms when price makes a lower low, but RSI makes a higher low. That can suggest downside momentum is fading.
Divergence is a warning sign, not a trade by itself. It becomes more useful when it appears near support, resistance, exhaustion candles, volume changes or a known catalyst.
RSI in trending markets
In an uptrend, traders may look for RSI pullbacks toward the 40–50 area rather than waiting for RSI to fall all the way to 30. In a downtrend, rallies toward the 50–60 area may become resistance.
This is why rigid RSI levels can be misleading. The same RSI reading can mean different things depending on whether the market is trending, ranging or breaking out.
RSI Trading Strategies
There is no single best RSI strategy. The indicator works differently in trends, ranges and volatile news-driven markets. The better approach is to give RSI a specific role.
Range strategy
In a sideways market, traders may look for RSI to fall into oversold territory near support, or rise into overbought territory near resistance. This is the classic RSI mean-reversion use case.
Trend-filter strategy
In an uptrend, RSI staying above 50 can confirm positive momentum. Pullbacks that hold above the 40–50 zone may be more useful than waiting for a textbook oversold reading below 30.
In a downtrend, RSI staying below 50 can confirm negative momentum. Rallies that fail around 50–60 can warn that sellers still control the market.
Divergence strategy
RSI divergence can help identify weakening momentum. Bearish divergence after a strong rally can warn that buying pressure is fading. Bullish divergence after a sharp selloff can warn that selling pressure is losing force.
The mistake is entering purely because divergence exists. Markets can diverge for a long time before turning. A better use is to combine divergence with price structure, support/resistance, volume, or a clear reversal pattern.
Swing rejection strategy
Wilder also described failure swings, sometimes called RSI swing rejection patterns. These focus on RSI’s own behaviour rather than directly comparing RSI with price.
A bullish failure swing occurs when RSI falls, rebounds, pulls back without making a new low, and then breaks above its previous RSI high.
A bearish failure swing occurs when RSI rises, pulls back, rebounds without making a new high, and then breaks below its previous RSI low.
The value of this pattern is that it asks RSI to show an internal momentum shift, not just touch an overbought or oversold level.
Pros and Cons of the RSI Indicator
RSI is popular because it is simple to read, widely available, and useful across many markets. But it is also one of the easiest indicators to misuse.
Pros
- Momentum clarity: RSI gives a quick view of whether recent closing-price gains are stronger than recent closing-price losses.
- Easy to interpret: RSI moves between 0 and 100, so traders can quickly compare readings across different markets and timeframes.
- Useful in ranges: In range-bound markets, overbought and oversold readings can help identify areas where price may be stretched.
- Divergence warnings: RSI divergence can highlight situations where price is making new highs or lows but momentum is not confirming the move.
- Works across markets: RSI can be applied to stocks, indices, futures, FX, commodities and crypto, although the settings may need adjusting.
- Good for filtering: RSI can help traders avoid taking long setups when momentum is weak, or short setups when momentum is still strong.
Cons
- Overbought does not mean sell: A strong uptrend can keep RSI above 70 for a long time. Selling only because RSI is high is a common mistake.
- Oversold does not mean buy: A strong downtrend can keep RSI below 30 while price continues falling.
- False divergence: RSI divergence can appear early and persist for a long time before price actually turns.
- Parameter sensitivity: A 14-period RSI is common, but it is not automatically best for every market or timeframe.
- Smoothing differences: Wilder-style RSI can differ from a simple moving-average RSI. Two platforms may not match exactly if they use different smoothing methods.
- Not a complete system: RSI can help judge momentum and market condition, but trade entries, stops, position sizing and market context still need to be handled separately.
Coding the RSI Indicator in Python
Now let’s build the RSI ourselves in Python and plot it under a candlestick chart.
This part is useful because RSI is not always calculated the same way in quick online examples. Wilder’s original RSI uses a smoothing method for average gains and losses. A simple rolling-average version can look noticeably different, especially around sharp moves.
We will use Python, yfinance (yahoo) for market data, pandas for the calculations, and mplfinance/matplotlib to plot the chart. I’m using VSCode here, but the same code can run in another Python environment if you prefer.
Create a new Python file called something like rsi_chart.py. Then paste each code block below into the same file in order.
Step 1: Import Required Libraries
First we import the libraries. These are the tools Python needs before it can download data, calculate the RSI, and draw the chart.
import numpy as np
import pandas as pd
import yfinance as yf
import mplfinance as mpf
import matplotlib.pyplot as plt
from matplotlib.lines import Line2D
These are:
- numpy: used for numerical operations and handling special values.
- pandas: used for working with price data in table form.
- yfinance: downloads historical market data from Yahoo Finance.
- mplfinance: creates candlestick and volume charts.
- matplotlib.pyplot: displays the finished chart.
- matplotlib.lines.Line2D: lets us create clean legend labels for the RSI and reference lines.
If these libraries are not already installed, open a terminal in VSCode and run the command below. Using python -m pip is safer than just typing pip, because it installs the packages into the Python version that is actually running your script.
python -m pip install yfinance pandas numpy mplfinance matplotlibStep 2: Define the RSI Calculation Function
Next we define the RSI calculation.
The default method below is Wilder-style smoothing, which is what most traders expect when they load RSI on a proper charting platform. I have also included a simple moving-average option so you can compare the difference for yourself.
That comparison is worth doing. Two RSI lines can be based on the same price data and same 14-period setting, but still look different if the smoothing method is different.
def calculate_rsi(close, period=14, method="wilder"):
    """
    Calculate RSI using either Wilder-style smoothing or a simple rolling average.

    close:
        pandas Series of closing prices.

    period:
        RSI lookback period. Wilder's common default is 14.

    method:
        "wilder" = Wilder-style smoothing
        "simple" = simple rolling-average RSI, useful for comparison
    """

    delta = close.diff()

    gain = delta.clip(lower=0)
    loss = -delta.clip(upper=0)

    if method == "simple":
        # Simple moving-average version.
        # This is useful for comparison, but it may not match most charting platforms.
        avg_gain = gain.rolling(window=period, min_periods=period).mean()
        avg_loss = loss.rolling(window=period, min_periods=period).mean()

    elif method == "wilder":
        # Wilder-style RSI.
        # First value uses a simple average, then subsequent values are smoothed.
        avg_gain = pd.Series(np.nan, index=close.index, dtype="float64")
        avg_loss = pd.Series(np.nan, index=close.index, dtype="float64")

        avg_gain.iloc[period] = gain.iloc[1:period + 1].mean()
        avg_loss.iloc[period] = loss.iloc[1:period + 1].mean()

        for i in range(period + 1, len(close)):
            avg_gain.iloc[i] = ((avg_gain.iloc[i - 1] * (period - 1)) + gain.iloc[i]) / period
            avg_loss.iloc[i] = ((avg_loss.iloc[i - 1] * (period - 1)) + loss.iloc[i]) / period

    else:
        raise ValueError("method must be either 'wilder' or 'simple'")

    rs = avg_gain / avg_loss.replace(0, np.nan)
    rsi = 100 - (100 / (1 + rs))

    # Handle edge cases
    rsi[(avg_loss == 0) & (avg_gain > 0)] = 100
    rsi[(avg_gain == 0) & (avg_loss > 0)] = 0
    rsi[(avg_gain == 0) & (avg_loss == 0)] = 50

    return rsi
The function first looks at the change between each close and the previous close. Positive changes become gains. Negative changes become losses.
For the Wilder version, the first average gain and loss are calculated using a simple average. After that, the averages are smoothed using Wilder’s method.
For the simple version, the function uses a normal rolling average. This is included as a learning tool so you can see how much the smoothing method changes the final RSI line.
Step 3: Download the Data
Now we fetch recent Meta Platforms data from Yahoo Finance. You can replace META with any other ticker supported by Yahoo Finance.
ticker = "META"

data = yf.download(
    ticker,
    start="2024-01-01",
    auto_adjust=False,
    progress=False
)

# yfinance can sometimes return MultiIndex columns, so flatten them if needed.
if isinstance(data.columns, pd.MultiIndex):
    data.columns = data.columns.get_level_values(0)

data = data.dropna()This downloads daily price data for Meta Platforms. The auto_adjust=False setting keeps the standard OHLC columns visible, which makes the data easier to understand while learning.
The MultiIndex check is included because newer versions of yfinance can sometimes return columns in a slightly different format. Flattening the columns avoids plotting errors later.
Step 4: Calculate RSI and reference lines
Now we calculate the 14-period RSI using Wilder-style smoothing. This is the main RSI line we will plot.
data["RSI"] = calculate_rsi(data["Close"], period=14, method="wilder")
Optional experiment: compare Wilder RSI with a simple moving-average RSI.
The line below is commented out with a # mark, so Python will ignore it. After you run the script once and see the normal Wilder-style RSI, remove the # mark from the next line, save the file, and run it again. You will then plot a second RSI line using the simple moving-average method.
# data["RSI Simple"] = calculate_rsi(data["Close"], period=14, method="simple")This is a useful exercise because it shows why calculation details matter. “RSI 14” is not always identical if one version uses Wilder smoothing and another uses a simple rolling average.
Step 5: Add the 70, 50 and 30 Lines
Next we add the reference levels. The 70 and 30 lines are the classic overbought and oversold levels. The 50 line is useful because it acts as a rough momentum divider.
data["70 Line"] = 70
data["50 Line"] = 50
data["30 Line"] = 30
RSI above 50 suggests average gains are stronger than average losses. RSI below 50 suggests average losses are stronger than average gains.
The 70 and 30 lines are not automatic sell or buy levels. They are reference zones.
Step 6: Prepare the RSI Plot
Now we define the extra lines that will sit below the candlestick chart: the RSI line, the 70/30 lines, and the 50 line.
The code also checks whether you enabled the optional simple RSI line in Step 4. If you removed the # mark there, the simple RSI line will be added to the chart automatically.
add_plots = [
    mpf.make_addplot(data["RSI"], panel=2, color="b", ylabel="RSI", secondary_y=False),
    mpf.make_addplot(data["70 Line"], panel=2, color="r", linestyle="dashed", secondary_y=False),
    mpf.make_addplot(data["50 Line"], panel=2, color="black", linestyle="dashed", secondary_y=False),
    mpf.make_addplot(data["30 Line"], panel=2, color="r", linestyle="dashed", secondary_y=False),
]

# If you enabled the simple RSI comparison in Step 4, add it to the chart too.
if "RSI Simple" in data.columns:
    add_plots.append(
        mpf.make_addplot(data["RSI Simple"], panel=2, color="g", secondary_y=False)
    )
# Main chart panel, volume panel, RSI panel
# These are relative sizes, not exact pixel heights.
panel_sizes = (5, 1.5, 2)The price chart will appear in the top panel, volume in the middle panel, and RSI in the bottom panel.
If you enable the simple RSI comparison, the chart will show both RSI calculations so you can see where they differ.
Step 7: Plot the Chart
Finally, we create the chart and add a legend. This is where the candlesticks, volume bars and RSI panel are drawn together.
fig, axes = mpf.plot(
    data,
    type="candle",
    style="yahoo",
    addplot=add_plots,
    volume=True,
    volume_panel=1,
    panel_ratios=panel_sizes,
    title=f"{ticker} with RSI",
    ylabel="Price",
    figratio=(12, 8),
    figscale=1.1,
    returnfig=True
)

legend_lines = [
    Line2D([0], [0], color="b", lw=1.5),
    Line2D([0], [0], color="r", lw=1.2, linestyle="dashed"),
    Line2D([0], [0], color="black", lw=1.2, linestyle="dashed"),
]

legend_labels = ["RSI Wilder", "70 / 30 Lines", "50 Line"]

if "RSI Simple" in data.columns:
    legend_lines.append(Line2D([0], [0], color="g", lw=1.5))
    legend_labels.append("RSI Simple")

axes[2].legend(
    legend_lines,
    legend_labels,
    loc="lower left"
)

plt.show()If the legend line gives you an error on your version of mplfinance, replace axes[2].legend with axes[-1].legend. Different mplfinance versions can return the chart axes slightly differently.
axes[-1].legend(
    legend_lines,
    legend_labels,
    loc="lower left"
)Running the Script
Once all the code blocks are in the same Python file, save it.
In VSCode, you can usually run it by right-clicking inside the file and selecting Run Python File in Terminal. Depending on your setup, you may also be able to click the play button in the top-right corner.
If Python says a library is missing, install it using the python -m pip install command from Step 1, then run the script again.
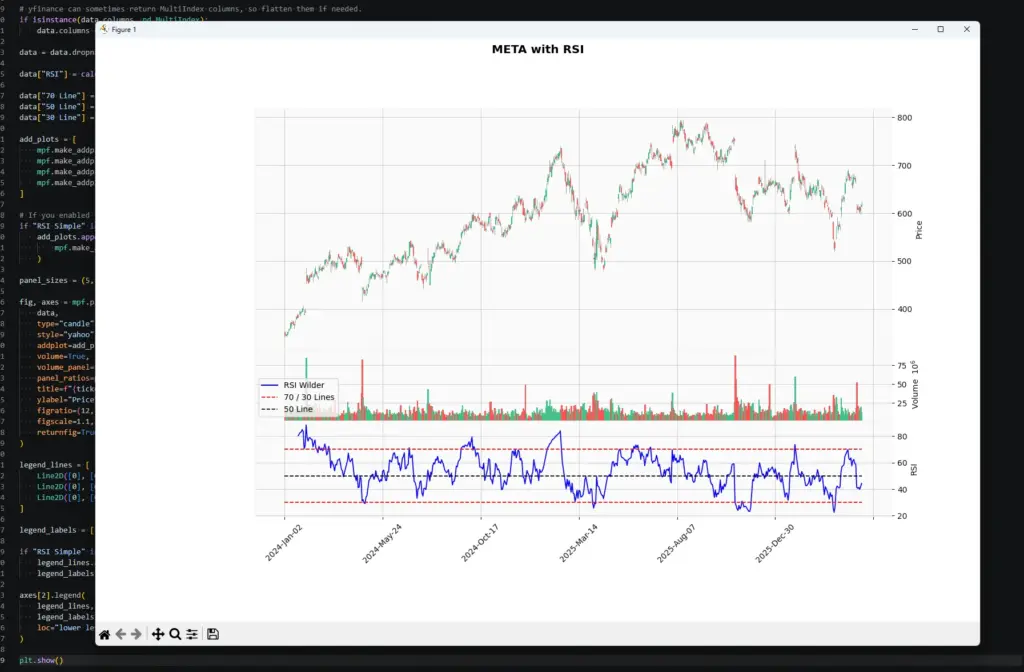
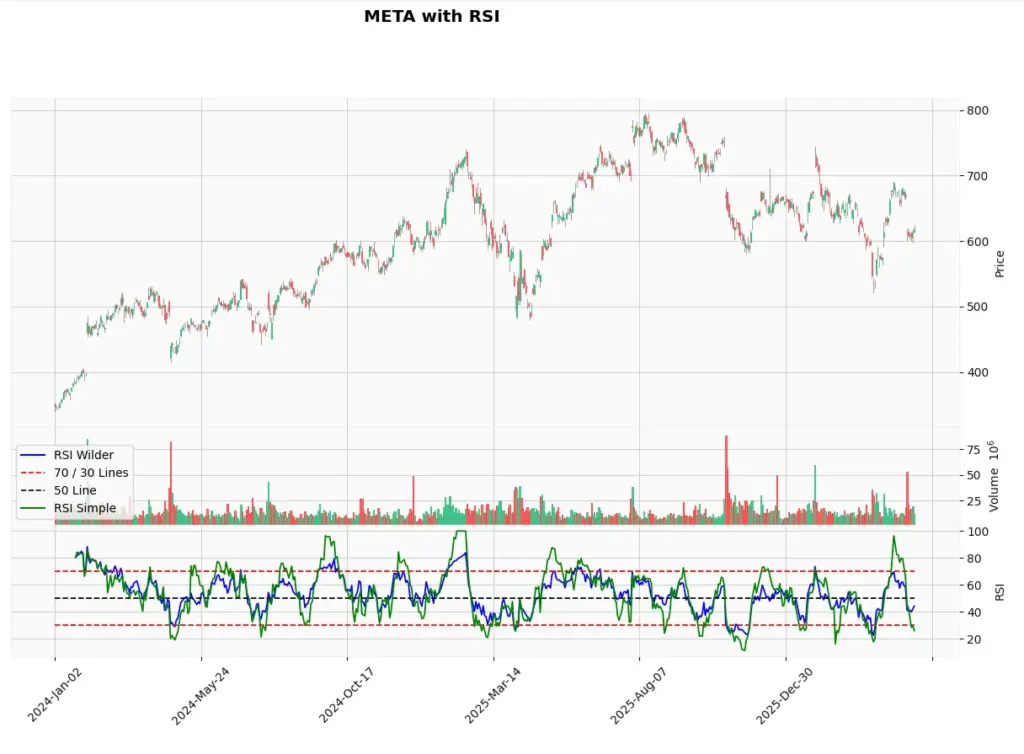
The chart shows RSI below the price and volume panels. The blue line is the 14-period RSI calculated with Wilder-style smoothing. The red dashed lines mark the common 70 and 30 reference levels, and the black dashed line marks 50.
If you enabled the simple RSI comparison, you should see a second RSI line. In this example, the blue line is Wilder-style RSI and the green line is the simple rolling-average version. They broadly follow the same rhythm, but they do not match exactly. That difference is the point of the exercise: two traders can both say they are using 14-period RSI while still seeing slightly different values if their software uses different smoothing.
Using the RSI Indicator for Screening Stocks
The Python code above can also be adapted into a simple RSI stock screener. Instead of plotting one ticker, you could loop through a list of symbols, calculate RSI for each one, and flag only the stocks that meet your conditions.
For example, a screener could look for:
- stocks with RSI below 30;
- stocks with RSI above 70;
- stocks where RSI has crossed back above 30 after being oversold;
- stocks where RSI is above 50 and price is above a moving average;
- possible bullish or bearish RSI divergence candidates;
- stocks where RSI conditions line up with candlestick patterns, volume changes or support and resistance.
The important point is that a screener should not be treated as a buy or sell machine. It is a filter. It reduces the number of charts you need to inspect manually.
For example, “RSI below 30” does not mean “buy this stock”. It means “this stock may be worth reviewing because momentum has become stretched to the downside”. You would still need to check the trend, news, earnings calendar, volume, support levels and broader market conditions.
This is where coding your own indicators becomes useful. Once you understand the RSI calculation, you can build alerts around your own rules instead of relying only on the default scans offered by a broker or charting platform.
Even a small improvement in filtering can matter. If a screener helps you avoid weak setups, stop chasing poor trades, or focus only on markets where your strategy performs better, it can improve your trading process over time.
Further Reading
For more on RSI, Wilder’s original indicators and technical analysis research, these are useful starting points:
- Books:
- J. Welles Wilder Jr., “New Concepts in Technical Trading Systems” This is the original book where Wilder introduced RSI, along with several other indicators such as ATR, Parabolic SAR and the Directional Movement system.
- John J. Murphy, “Technical Analysis of the Financial Markets” A broad technical analysis reference that includes RSI and many other common charting tools.
- Research and wider context
- “The Profitability of Technical Analysis: A Review” by Cheol-Ho Park and Scott H. Irwin (2007). This review paper discusses the profitability of various technical analysis indicators, including the RSI. Alphasquawk reviews it in our article here.
Related AlphaSquawk guides
- Our guide to the Accumulation Distribution Line for volume-based confirmation.
- Our MACD guide for trend-following momentum.
- Our Bollinger Bands guide for volatility and mean-reversion context.
- Our fundamental vs technical analysis guide for understanding when chart signals may be overridden by news or macro events.


