
Updated May 2026: I’ve refreshed this guide with clearer moving-average formulas, more actionable notes on day-trading settings, and cleaner Python examples for readers who want to test the calculations themselves.

What Is a Moving Average?
A moving average is the average price over a rolling number of bars.
If you hear that the S&P 500 is near its 200-day moving average, it means traders are comparing today’s price with the average closing price from roughly the last 200 trading days. Tomorrow, the calculation rolls forward. The newest close is added, the oldest one drops out, and the average updates.
That is why it is called a moving average. The average keeps moving as new bars are added.
On a chart, a moving average usually appears as a smooth line running through or near price. It does not show every jump and dip. It turns a noisy price chart into a steadier reference line, which traders then use to judge trend direction, support and resistance, and possible crossover signals.
The number attached to the moving average is the lookback period. A 20-period moving average on a daily chart uses 20 daily bars. A 20-period moving average on a 5-minute chart uses 20 candles of 5 minutes each. The calculation is similar, but the trading use can feel very different.
Moving averages are useful, but they are built from past prices. They do not know what the next candle will do. They can help you see trend context, but they can also react late or give messy signals in sideways markets.
This guide covers the main moving average types, including simple, smoothed, centered, weighted, exponential, median, TRIX and Exponential Hull. I’ll also show how to calculate them in Python and how I would think about the phrase “best moving averages for day trading” without pretending there is one perfect setting for every market.
How Moving Averages Became a Trading Tool
Averaging noisy data is much older than financial charting. Scientists, economists and statisticians were smoothing data long before traders were drawing moving averages on screens.
In trading, the attraction is the practical approach. One price print can be jumpy. A rolling average gives traders a steadier reference point. As each new bar arrives, the average updates, so the line keeps following the market without reacting to every small wiggle.
I was first taught moving averages in this trader-training context rather than as a classroom statistic. The point was not “this average predicts the future.” The point was discipline: define the trend, decide which time frame you are trading, and use the average as one part of a wider plan for entries, exits, filters and risk.
That is also where Dow Theory is worth mentioning. Charles Dow helped popularise the idea of studying market averages, trend direction and confirmation. Dow Theory was not a modern moving-average formula sheet, but it shaped the way traders came to think about averages, trends and confirmation rather than isolated price moves.
As charting software became easier to use, traders started testing different versions of the same smoothing idea. The simple moving average gave every bar equal weight. The exponential and weighted moving averages gave more influence to recent prices. Other versions were designed to smooth more aggressively, reduce lag, handle outliers, or analyse cycles.
That is why there are so many moving averages in this guide. They all start with the same basic problem: price is noisy, and traders want a cleaner reference line. The difference is how each moving average decides which prices deserve the most influence.
| Moving-average use | What it helps with |
|---|---|
| Smooth noisy price action | Reduces some short-term chart clutter |
| Identify trend direction | Shows whether the average is rising, falling, or flat |
| Compare price with its average | Helps judge whether price is trading above or below its recent mean |
| Compare fast and slow averages | Separates shorter-term movement from longer-term trend |
| Trail support or resistance | Gives traders a dynamic reference line |
| Filter other signals | Helps avoid taking every signal in a sideways or conflicting market |
Moving Average Formulas and Calculations
Moving averages all start with the same idea. Take a price series, choose a lookback period, and produce a smoother line.
The differences come from how each method treats the prices inside the lookback window. Some give every price the same weight. Some give more weight to recent prices. Some use the median instead of the average. Some shift the result for analysis rather than live trading.
In the formulas below:
P means price.
n means the number of periods in the moving average.
t means the current bar.
t – 1 means the previous bar.
When I say price, I usually mean the close. Some traders use another input, such as typical price, median price, or adjusted close, but close is the easiest starting point.
Simple Moving Average (SMA)
The Simple Moving Average is the cleanest version. It adds the prices in the lookback window and divides by the number of periods.
SMA_t = \frac{P_t + P_{t-1} + \cdots + P_{t-n+1}}{n}SMA = sum of the last n prices / n
For example, a 5-period SMA adds the latest five closing prices and divides by 5. When a new bar appears, the newest close is added and the oldest one drops out.
Smoothed Moving Average (SMMA)
The Smoothed Moving Average updates more slowly than a normal SMA. After the first value is seeded, each new value is based on the previous SMMA and the latest price.
SMMA_t = \frac{SMMA_{t-1}(n-1) + P_t}{n}SMMA today = (previous SMMA × (n – 1) + current price) / n
The first SMMA value is usually started with a simple moving average. After that, the formula keeps carrying the previous smoothed value forward, which makes the line slower and less jumpy.
Centered Moving Average (CMA)
A Centered Moving Average places the average in the middle of the lookback window instead of at the most recent bar. This can be useful for studying cycles or cleaning up historical data, but it is not a normal live-trading signal.
CMA_t = \frac{P_{t-k} + P_{t-k+1} + \cdots + P_{t+k}}{n}CMA = average of prices around the centre point of the window
Here, k is half the lookback window. A 5-period centered moving average uses two bars before the centre point, the centre bar, and two bars after it.
That last part is the important warning. A centered moving average needs future bars to be known before it can be plotted in the centre of the window. It is fine for historical analysis, but it should not be treated like an indicator that would have been available in real time.
Weighted Moving Average (WMA)
The Weighted Moving Average gives more influence to recent prices. In the common linear version, the newest price gets the largest weight and the oldest price gets the smallest weight.
WMA_t = \frac{nP_t + (n-1)P_{t-1} + \cdots + 1P_{t-n+1}}{n + (n-1) + \cdots + 1}WMA = weighted sum of prices / sum of weights
For a 3-period WMA, the newest price is multiplied by 3, the previous price by 2, and the oldest price by 1. The result is divided by 6, which is the sum of the weights.
Because recent prices carry more weight, WMA usually reacts faster than SMA. That can be useful for day trading, but it can also make the line more sensitive to short-lived noise.
Exponential Moving Average (EMA)
The Exponential Moving Average also gives more influence to recent prices, but it does it through a recursive smoothing formula rather than a fixed linear set of weights.
EMA_t = \alpha P_t + (1-\alpha)EMA_{t-1}EMA today = alpha × current price + (1 – alpha) × previous EMA
\alpha = \frac{2}{n+1}Alpha = 2 / (n + 1)
The alpha value controls how quickly the EMA reacts. A smaller n gives a larger alpha, so the EMA reacts faster. A larger n gives a smaller alpha, so the EMA moves more slowly.
EMA is popular with short-term traders because it responds faster than SMA of the same period. The trade-off is that it can also respond to noise more quickly.
Median Moving Average (MMA)
The Median Moving Average uses the median price in the lookback window instead of the arithmetic mean.
MMA_t = Median(P_t, P_{t-1}, \ldots, P_{t-n+1})MMA = median of the last n prices
The median is the middle value after the prices are sorted. This can make the line less sensitive to one-off spikes or outlier prices than a normal average.
TRIX: Triple-Smoothed EMA Momentum
TRIX is often grouped with moving averages, but it is better described as a momentum oscillator built from moving averages. It starts with the close, applies three EMA passes, and then measures the one-period percentage change of the third EMA.
Smooth the price once to create EMA1.
EMA1_t = \alpha P_t + (1-\alpha)EMA1_{t-1}Smooth EMA1 to create EMA2.
EMA2_t = \alpha EMA1_t + (1-\alpha)EMA2_{t-1}Smooth EMA2 to create EMA3.
EMA3_t = \alpha EMA2_t + (1-\alpha)EMA3_{t-1}Convert EMA3 into TRIX by measuring its percentage change from the previous bar.
TRIX_t = 100 \times \frac{EMA3_t - EMA3_{t-1}}{EMA3_{t-1}}TRIX = 100 × (current third EMA – previous third EMA) / previous third EMA
A normal moving average shows a smoothed price level. TRIX shows whether that triple-smoothed level is rising or falling compared with the previous bar. Positive TRIX values mean the smoothed series is rising. Negative values mean it is falling.
Because the input has been smoothed three times, TRIX can filter out some short-term noise. It is still built from past prices, so I would treat it as a momentum filter rather than a prediction tool on its own. See our full TRIX indicator guide for the dedicated formula, signals and Python walkthrough.
Exponential Hull Moving Average (EHMA)
The Exponential Hull Moving Average, or EHMA, is a Hull-style moving average designed to reduce lag while still smoothing price.
A normal moving average smooths price but reacts late. A faster moving average reacts sooner but can become noisy. Hull-style moving averages try to deal with that trade-off by comparing a faster weighted moving average with a slower weighted moving average, then smoothing the result again.
The version used here has four steps.
Calculate a WMA using half the lookback period.
WMA_{n/2}First calculate a faster weighted moving average using n / 2 periods.
Multiply that faster WMA by 2.
2 \times WMA_{n/2}This gives extra emphasis to the faster-moving part of the calculation.
Subtract the full-period WMA.
RawHull_t = 2 \times WMA_{n/2}(P_t) - WMA_n(P_t)Raw Hull step = 2 × faster WMA – slower WMA
This step is the lag-reduction part. It compares the faster average with the slower one, creating a more responsive intermediate line.
Smooth the result with an EMA using the square root of n.
EHMA_t = EMA_{\sqrt{n}}(RawHull_t)EHMA = EMA of the raw Hull step, using square root of n as the smoothing period
For example, if n is 16, the final smoothing period is based on the square root of 16, which is 4.
The point of EHMA is to create a moving average that reacts faster than a plain SMA or EMA of the same headline period. That can be useful for short-term charts, but faster is not automatically better. A more responsive line can also produce more whipsaws when the market is choppy.
Some platforms use slightly different Hull-style variants. The classic Hull Moving Average usually finishes with a WMA smoothing step. In this article, EHMA refers to the version that uses an EMA for the final smoothing step.
Here is the quick trader’s summary of the moving averages covered above
| Moving average | Main idea | Potential use | Main caution |
|---|---|---|---|
| SMA | Gives every price in the window equal weight | Clean baseline trend filter and widely watched reference line | Can react slowly |
| SMMA | Carries forward the previous smoothed value | Slower trend smoothing where you want fewer small wiggles | More lag than faster averages |
| CMA | Centres the average in the middle of the window | Historical analysis, cycle study, cleaner retrospective trend view | Uses future bars, so not suitable as a live signal |
| WMA | Gives more weight to recent prices | Faster reaction for short-term trend or timing work | More sensitive to noise |
| EMA | Uses exponential weighting toward recent prices | Popular trend filter for shorter-term traders | Can still whipsaw in ranges |
| MMA | Uses the median instead of the mean | Reducing the effect of one-off price spikes | Can ignore some real momentum shifts |
| TRIX | Turns a triple-smoothed EMA into momentum | Filtering smoothed momentum around a zero line | Can lag because of heavy smoothing |
| EHMA | Uses a Hull-style lag-reduction step with EMA smoothing | Faster moving-average style line for short-term charts | Faster reaction can mean more false turns |
This is why “best moving average” is the wrong question on its own. The better question is what you want the line to do: react faster, smooth more heavily, reduce outliers, study cycles, or turn smoothed price into a momentum reading.
What Moving Averages Are Good At
Moving averages are trend filters. They take price data that can be jumpy from bar to bar and turn it into a steadier line.
That line gives traders a reference point. Is price above or below its recent average? Is the average rising, falling, or flattening? Is the short-term average moving faster than the longer-term average?
Those questions are useful because they force a trader to define the market they are looking at. A rising moving average does not guarantee the next bar will rise, but it does show that the recent average price has been moving higher.
Moving averages are also useful because they can act as dynamic support or resistance. In a trend, price may pull back toward a widely watched average, pause, and then continue. That does not happen every time, but it is common enough that traders watch those areas.
Different moving averages answer the same basic problem in different ways. SMA is a clean baseline. EMA and WMA react faster because they give more influence to recent prices. Median moving averages can reduce the effect of outlier prices. Centered moving averages are better suited to historical analysis than live signals.
The main limitation is built in from the start. Moving averages are based on past prices. They can help organise a chart, but they do not remove uncertainty.
How Traders Read Moving Average Signals
The simplest moving-average reading is the slope of the line.
If the moving average is rising, the recent average price is rising. If it is falling, the recent average price is falling. If it is flat, the market may be ranging, pausing, or losing direction.
The next reading is price versus the moving average. Price above a moving average often supports a bullish trend view. Price below it often supports a bearish trend view. I would use “supports” deliberately. A move above or below an average is context, not a complete trading plan.
Crossovers are the most widely known moving-average signal. A shorter moving average crossing above a longer moving average is usually read as bullish. A shorter moving average crossing below a longer moving average is usually read as bearish.
The classic example is the 50-day and 200-day moving average. When the 50-day average crosses above the 200-day average, traders often call it a golden cross. When it crosses below, they call it a death cross. Those labels sound dramatic, but the signal is still delayed because both lines are built from historical prices.
For day trading, the same idea can be applied to shorter bars and shorter lookbacks. A trader might test a faster EMA against a slower EMA on a 5-minute or 15-minute chart. The danger is that shorter settings can create a lot of crosses in sideways markets.
This is where market context matters. Moving averages tend to behave best when a market is trending. In a choppy range, the same crossover logic can turn into repeated whipsaws.
| Signal | What it shows | How I would read it |
|---|---|---|
| Moving average rising | Recent average price is moving higher | Supports an upward trend view |
| Moving average falling | Recent average price is moving lower | Supports a downward trend view |
| Price above moving average | Price is trading above its recent average | Bullish context, not a standalone trigger |
| Price below moving average | Price is trading below its recent average | Bearish context, not a standalone trigger |
| Fast average crosses above slow average | Shorter-term average turns up versus longer-term average | Possible bullish confirmation |
| Fast average crosses below slow average | Shorter-term average turns down versus longer-term average | Possible bearish confirmation |
| Repeated crosses in a tight range | Averages are being chopped around | Possible whipsaw environment |
Moving Average Pros and Cons
Moving averages are popular because they are easy to see and easy to test. A single line can make a messy chart more readable, especially when the market is trending.
They are also flexible. The same calculation can be applied to daily, weekly, hourly, 5-minute or tick data. A trader can use one moving average for trend context, two moving averages for crossovers, or a group of averages to show short-term and long-term structure.
The weakness is lag. A moving average waits for price data before it moves. The smoother the line, the more delay it usually has. A very fast average reacts sooner, but it can also twitch around in noise.
Moving averages can also become misleading in sideways markets. Price may cross above and below the average repeatedly without producing a clean move. This is why a moving average that looks excellent in a trend can feel useless in a range.
The practical use is not to find a perfect line. It is to choose a moving average that matches the job. A slower average can help define the broader trend. A faster average can help with short-term timing. Neither one is a substitute for risk control or market context.
| Strength | Why it helps |
|---|---|
| Easy to understand | The line shows the average price over a rolling window |
| Good trend filter | Helps show whether price is generally rising, falling, or flat |
| Works across time frames | Can be used on daily, intraday, weekly or other charts |
| Useful for crossovers | Lets traders compare shorter-term and longer-term movement |
| Can act as dynamic support or resistance | Widely watched averages can become reference areas |
| Weakness | Why it matters |
|---|---|
| Lag | Signals arrive after price has already moved |
| Whipsaws | Sideways markets can create repeated false crosses |
| Setting sensitivity | Different lookbacks can give very different readings |
| Overcrowding | Too many moving averages can make a chart harder to read |
| Past-price dependence | Moving averages smooth history rather than predict the future |
Now we can build the moving averages ourselves. The Python section below keeps the examples practical: calculate each moving average, add it to a data table, and then plot one of them on a chart so you can see how the line behaves.
Implementing Moving Averages in Python with VS Code
Now we can turn the formulas into Python.
This section is a reference set of moving-average functions rather than one single trading system. You can copy the function you need, apply it to a closing-price column, and then test how the result behaves.
I am using pandas for the rolling-window calculations and numpy for weighted-average work. Later, when we plot a chart, we will also use yfinance, mplfinance and matplotlib.
Open a terminal in VS Code by clicking Terminal > New Terminal, then run:
python -m pip install pandas numpyOn some Windows machines, this version works instead:
py -m pip install pandas numpyIf you also want to run the chart example near the end of this section, install the charting libraries too:
python -m pip install yfinance mplfinance matplotlibOr on Windows:
py -m pip install yfinance mplfinance matplotlibCreate a new Python file, for example:
moving_averages.py
At the top of the file, import the libraries:
import pandas as pd
import numpy as npThe examples below assume you already have a pandas DataFrame called data, with a Close column containing closing prices.
For example, each moving average is added like this:
data["SMA"] = calculate_sma(data["Close"], window=14)Think of data as a spreadsheet. Close is one column in that spreadsheet. The new moving average becomes another column.
Simple Moving Average (SMA)
The simple moving average is the shortest function in this guide. pandas takes the closing-price series, creates a rolling window, and calculates the mean of each window.
def calculate_sma(close, window=14):
return close.rolling(window=window).mean()
data["SMA"] = calculate_sma(data["Close"], window=14)
rolling(window=window) tells pandas how many bars to include.
mean() calculates the average of those bars.
The first few values will be blank because pandas needs enough bars to fill the first window.
Smoothed Moving Average (SMMA)
The smoothed moving average starts with an SMA, then updates each new value from the previous SMMA and the latest price.
def calculate_smma(close, window=14):
smma = close.copy()
smma.iloc[:window] = close.iloc[:window].mean()
for i in range(window, len(close)):
smma.iloc[i] = ((smma.iloc[i - 1] * (window - 1)) + close.iloc[i]) / window
smma.iloc[:window - 1] = np.nan
return smma
data["SMMA"] = calculate_smma(data["Close"], window=14)
The first usable SMMA value is seeded with a simple average.
After that, the formula carries forward the previous smoothed value. That is why SMMA usually reacts more slowly than SMA.
Centered Moving Average (CMA)
A centered moving average is useful for historical analysis, but it needs a warning. The line is shifted back so the average sits in the middle of the window. That means it uses future bars from the point of view of the chart position.
def calculate_cma(close, window=14):
offset = window // 2
return close.rolling(window=window).mean().shift(-offset)
data["CMA"] = calculate_cma(data["Close"], window=14)
The shift(-offset) part moves the result backward by half the window.
That makes the line visually centred, but it also means the value would not have been available in real time. I would not use a centered moving average as a live trading signal.
Weighted Moving Average (WMA)
The weighted moving average gives the most recent price the largest weight.
def calculate_wma(close, window=14):
weights = np.arange(1, window + 1)
return close.rolling(window=window).apply(
lambda prices: np.dot(prices, weights) / weights.sum(),
raw=True
)
data["WMA"] = calculate_wma(data["Close"], window=14)
np.arange(1, window + 1) creates the weights.
For a 14-period WMA, the oldest price gets weight 1 and the newest price gets weight 14.
np.dot(prices, weights) multiplies each price by its weight. Dividing by weights.sum() turns that weighted total back into an average.
Exponential Moving Average (EMA)
pandas has a built-in ewm() method for exponential moving averages, so the EMA function is compact.
def calculate_ema(close, window=14):
return close.ewm(span=window, adjust=False).mean()
data["EMA"] = calculate_ema(data["Close"], window=14)
span=window connects back to the n value in the EMA formula.
adjust=False makes pandas use the recursive EMA style traders usually expect, where the current EMA depends on the current price and the previous EMA.
The EMA usually reacts faster than an SMA with the same period because recent prices have more influence.
Median Moving Average (MMA)
The median moving average uses the middle value inside the rolling window rather than the arithmetic mean.
def calculate_mma(close, window=14):
return close.rolling(window=window).median()
data["MMA"] = calculate_mma(data["Close"], window=14)
median() sorts the values inside each rolling window and takes the middle value.
That can make the line less sensitive to a single unusual spike than a normal average.
TRIX: Triple-Smoothed EMA Momentum
TRIX is not a normal moving-average overlay. It smooths price three times with EMAs, then measures the percentage change of the third EMA.
def calculate_trix(close, window=14):
ema1 = close.ewm(span=window, adjust=False).mean()
ema2 = ema1.ewm(span=window, adjust=False).mean()
ema3 = ema2.ewm(span=window, adjust=False).mean()
trix = 100 * ema3.pct_change()
return trix
data["TRIX"] = calculate_trix(data["Close"], window=14)
ema1 smooths the close.
ema2 smooths ema1.
ema3 smooths ema2.
pct_change() then compares the current EMA3 value with the previous EMA3 value. Multiplying by 100 expresses the result as a percentage.
This matches the TRIX formula used earlier in the article and in the dedicated TRIX guide.
Exponential Hull Moving Average (EHMA)
This EHMA function first builds the raw Hull-style step from two weighted moving averages, then smooths that result with an EMA.
def calculate_ehma(close, window=14):
half_window = max(int(round(window / 2)), 1)
sqrt_window = max(int(round(np.sqrt(window))), 1)
wma_full = calculate_wma(close, window=window)
wma_half = calculate_wma(close, window=half_window)
raw_hull = (2 * wma_half) - wma_full
ehma = raw_hull.ewm(span=sqrt_window, adjust=False).mean()
return ehma
data["EHMA"] = calculate_ehma(data["Close"], window=14)
half_window is the faster WMA length.
sqrt_window is the final smoothing length.
raw_hull compares the faster WMA with the slower WMA.
The final ewm() call smooths that raw Hull-style line into the EHMA.
This function reuses calculate_wma(), so place the WMA function above the EHMA function in your file.
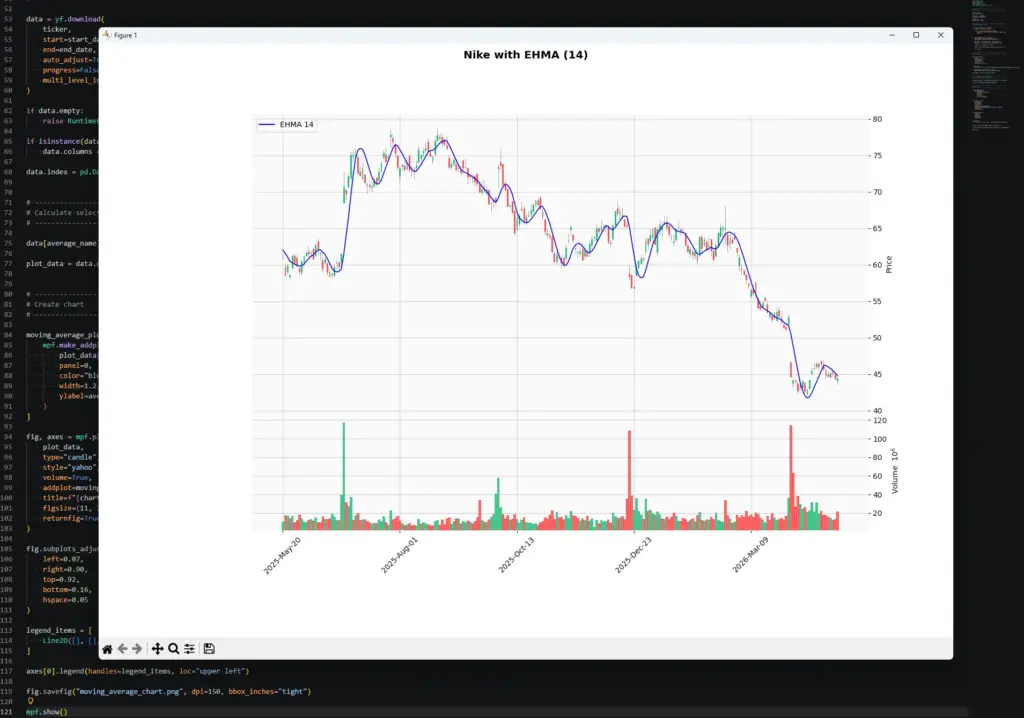
How to Plot One Moving Average on a Chart
Now let’s plot one of the moving averages on a candlestick chart.
For this example I use Nike stock and EHMA. You can change the ticker, date range, moving-average type, or window near the top of the script.
import pandas as pd
import numpy as np
import yfinance as yf
import mplfinance as mpf
from matplotlib.lines import Line2D
# ------------------------------------------------------------
# Settings
# ------------------------------------------------------------
ticker = "NKE"
chart_title = "Nike"
start_date = "2025-05-01"
end_date = "2026-05-01"
window = 14
average_name = "EHMA"
# ------------------------------------------------------------
# Moving-average functions
# ------------------------------------------------------------
def calculate_wma(close, window=14):
weights = np.arange(1, window + 1)
return close.rolling(window=window).apply(
lambda prices: np.dot(prices, weights) / weights.sum(),
raw=True
)
def calculate_ehma(close, window=14):
half_window = max(int(round(window / 2)), 1)
sqrt_window = max(int(round(np.sqrt(window))), 1)
wma_full = calculate_wma(close, window=window)
wma_half = calculate_wma(close, window=half_window)
raw_hull = (2 * wma_half) - wma_full
ehma = raw_hull.ewm(span=sqrt_window, adjust=False).mean()
return ehma
# ------------------------------------------------------------
# Download data
# ------------------------------------------------------------
data = yf.download(
ticker,
start=start_date,
end=end_date,
auto_adjust=True,
progress=False,
multi_level_index=False
)
if data.empty:
raise RuntimeError("No data was downloaded. Check the ticker symbol and date range.")
if isinstance(data.columns, pd.MultiIndex):
data.columns = data.columns.get_level_values(0)
data.index = pd.DatetimeIndex(data.index)
# ------------------------------------------------------------
# Calculate selected moving average
# ------------------------------------------------------------
data[average_name] = calculate_ehma(data["Close"], window=window)
plot_data = data.dropna(subset=[average_name])
# ------------------------------------------------------------
# Create chart
# ------------------------------------------------------------
moving_average_plot = [
mpf.make_addplot(
plot_data[average_name],
panel=0,
color="blue",
width=1.2,
ylabel=average_name
)
]
fig, axes = mpf.plot(
plot_data,
type="candle",
style="yahoo",
volume=True,
addplot=moving_average_plot,
title=f"{chart_title} with {average_name} ({window})",
figsize=(11, 7),
returnfig=True
)
fig.subplots_adjust(
left=0.07,
right=0.90,
top=0.92,
bottom=0.16,
hspace=0.05
)
legend_items = [
Line2D([], [], color="blue", label=f"{average_name} {window}")
]
axes[0].legend(handles=legend_items, loc="upper left")
fig.savefig("moving_average_chart.png", dpi=150, bbox_inches="tight")
mpf.show()
This script downloads the price data, calculates the EHMA, adds it to the chart, saves a PNG image, and opens the chart window.
To plot a different average, replace the calculate_ehma() call with a different function from the earlier examples and change average_name. For example, you could calculate an EMA and set average_name = “EMA”.
Python Chart Output
You ought to get a chart output similar to mine when below when executing the .py file.
Best Moving Averages for Day Trading and How to Use Them
There is no single best moving average for day trading. The better question is what job you want the moving average to do.
If you want a faster line for intraday timing, EMA, WMA or EHMA are worth testing because they react more quickly to recent price. The drawback is that they can also react more quickly to noise.
If you want a cleaner reference level, a simple moving average can still be useful. The 50-day and 200-day averages sound far removed from intraday trading, but they are widely watched. If price is approaching one of those levels, short-term traders may still care because other traders, funds and commentators care.
One beginner mistake is assuming that every touch of a moving average is a trade. Price pulls back to the line, the candle touches it, and it feels like the chart is giving you a clear buy or sell level.
Sometimes that can work. In a clean trend, a moving average can act like dynamic support or resistance. Price pulls back toward it, pauses, and then continues in the trend direction.
The problem is that the moving average is not a wall. Price can slice straight through it, hover around it, or cross it several times in a sideways market. A touch of the line is only useful if the wider chart supports the idea.
If I were using a moving average touch as part of a day-trading setup, I would want to know a few things first.
Is the market actually trending?
Is price pulling back calmly, or is it falling aggressively through the average?
Is the moving average rising, falling, or flat?
Is the touch happening near another level traders may care about, such as prior support, resistance, VWAP, or a higher-time-frame level?
Does the candle reaction show rejection, or did price simply tag the line and keep going?
That is why I would treat a moving average touch as a setup area, not a trade by itself. The line can tell you where to pay attention. Price action still has to do some work.
For intraday charts, I would usually separate the job into two parts. Use a slower average or higher-time-frame level to understand the bigger backdrop. Use a faster average only if it helps with timing on the chart you are actually trading.
Crossovers can help, but I would not treat them as automatic entries. A fast average crossing above a slower average can support a bullish view. A fast average crossing below can support a bearish view. In a sideways market, the same setup can chop back and forth until the trader is worn down.
Moving averages work best when the market is actually moving. In a strong trend, they can help you stay aligned with direction. In a range, they can become a mess of late signals, repeated crosses, and fake touches.
I would also avoid filling the chart with too many averages. Two or three lines can be useful. Six or seven can start to look like a plate of spaghetti. If you cannot explain what each line is doing, it probably does not belong on the chart.
That is a more practical way to think about the best moving averages for day trading. It is less about finding the one perfect line and more about choosing the right reference line for the trade you are trying to take.
| Day-trading use | Moving average approach | Main warning |
|---|---|---|
| Faster intraday timing | EMA, WMA or EHMA | More sensitive to noise |
| Cleaner trend context | SMA or slower EMA | Later signals |
| Widely watched reference level | 50-day or 200-day SMA | Not an intraday timing tool by itself |
| Pullback to the average | Price tests a rising or falling MA | A touch is not a signal without confirmation |
| Crossover testing | Fast MA versus slow MA | Can whipsaw badly in ranges |
| Dynamic support or resistance | Price reacts around a chosen MA | The line can break cleanly in fast markets |
Combining moving averages with other indicators
When adding other indicators, I would avoid stacking tools that all tell you the same thing. MACD, RSI, Stochastics and three moving averages may look impressive, but the chart can quickly become harder to read.
A better approach is to combine different types of information.
A moving average can help define trend direction. A momentum indicator can help show whether the move is strengthening or fading. Volume can help show whether the move has participation behind it. Price structure can show where support, resistance, breakouts or failed breaks are forming.
MACD is a natural comparison because it is also built from moving averages. It can help show momentum changes around the trend, but it is not independent confirmation if your chart is already full of moving-average signals.
RSI and Stochastics are different because they are bounded oscillators. They can help show stretched or fading momentum, although they can also stay overbought or oversold in strong trends.
TRIX sits somewhere between the two worlds. It is built from triple-smoothed EMAs, but it is read as a momentum oscillator around a zero line.
The point is not to collect indicators. The point is to avoid asking one moving average to answer every question on the chart.
| Tool | What it adds beside a moving average | Main warning |
|---|---|---|
| MACD | Momentum changes built from moving averages | Not fully independent confirmation |
| RSI | Bounded momentum / stretched conditions | Can stay overbought or oversold in trends |
| Stochastics | Where price closes inside its recent range | Works better with range context |
| TRIX | Triple-smoothed momentum around a zero line | Can lag because of heavy smoothing |
| Volume | Participation behind the move | Interpretation varies by market |
Final Thoughts on Moving Averages
Moving averages are popular because they make a chart easier to organise. They smooth price, show direction, and give traders a reference line that updates with every new bar.
The important part is knowing what kind of line you are looking at. SMA is a clean baseline. EMA and WMA react faster. SMMA is slower. Median moving averages can reduce the effect of outliers. Centered moving averages are useful for historical analysis but not live signals. TRIX turns a triple-smoothed EMA into a momentum reading. EHMA tries to reduce lag while keeping some smoothing.
None of those versions removes uncertainty. A moving average can help define trend, support, resistance, timing, or context, but it cannot decide the trade for you.
When I first began trading professionally, I shared a chart screen with other traders and was not always sure why someone had a particular indicator or moving average on it. It is tempting to copy what looks clever on another trader’s chart. The better lesson is to make your own rule for what each line means.
If a moving average is on your chart, it should have a job. Maybe it defines trend. Maybe it marks an area where you look for pullbacks. Maybe it filters trades in the wrong direction. Maybe it is there because a wider market audience watches it.
What it should not be is decoration.
Test the moving averages yourself. Change the lookback. Change the market. Change the time frame. Watch how the same formula behaves differently. That is far more useful than accepting someone else’s favourite setting as if it applies everywhere.
References and Further Reading
- Murphy, John J. Technical Analysis of the Financial Markets. New York Institute of Finance, 1999.
- Achelis, Steven B. Technical Analysis from A to Z. McGraw Hill, 2001.
- Kirkpatrick, Charles D., and Dahlquist, Julie R. Technical Analysis: The Complete Resource for Financial Market Technicians. FT Press, 2010.
- Pring, Martin J. Technical Analysis Explained. McGraw Hill, 2014.


