Updated May 2026: I’ve refreshed this guide to make the TRIX formula clearer, tweak the Python rate-of-change calculation later in the tutorial, and explain the code better for traders who want the chart output but do not write Python every day.

What is the TRIX Indicator?
TRIX is a momentum oscillator made from a triple-smoothed exponential moving average. Smoothing just means taking some of the jaggedness out of a price series. Instead of reacting to every single close as if it carries equal importance, an exponential moving average blends the latest close with earlier values, while giving more weight to recent prices.
The simple way I think about TRIX is: smooth the closing price once, smooth that result again, smooth it a third time, then measure how much the final smoothed line has changed since the previous bar.
The last step is the part people often skip. TRIX is not the same thing as plotting a triple-smoothed moving average on top of price. The indicator you see below the chart is the percentage change in that smoothed line, which is why it sits around a zero line instead of following price directly.
A positive TRIX reading means the triple-smoothed line is rising. A negative reading means it is falling. Traders then use that information in a few different ways: zero-line crosses, signal-line crosses, and divergences between price and the indicator.
The trade-off is the usual one with smoothing. TRIX can make a noisy chart easier to read, but every extra smoothing pass adds delay. A clean TRIX turn after a trend pullback can be useful. A TRIX cross in the middle of a choppy range can be little more than another late wiggle.
In this guide I’ll walk through where TRIX came from, how the formula works, how traders read the main signals, and how to build the indicator in Python step by step.
History and Origin of the TRIX Indicator
TRIX is generally credited to Jack K. Hutson, founder and editor of Technical Analysis of Stocks & Commodities. Hutson’s original TRIX article appeared in the early 1980s under the title “Good TRIX,” and described a method based on triple exponential smoothing followed by a one-period momentum reading.
There is a small historical wrinkle worth knowing. Hutson’s original description referred to smoothing the logarithm of daily market closes before taking the one-day momentum reading. Many modern charting platforms describe TRIX more simply as the percentage rate of change of a triple-smoothed EMA (exponential moving average). That is the version most traders now expect to see when they add TRIX to a chart, and it is the version we will code later in this guide.
For our purposes, both versions lead to the same practical idea. TRIX is not the triple-smoothed average itself. It is the change in that smoothed series. That distinction is where a lot of lazy explanations of the indicator go wrong.
How TRIX Is Calculated
TRIX has four moving parts: three exponential moving average passes, then one percentage-change calculation.
An exponential moving average, or EMA, is a weighted average that reacts more to recent prices than old prices. Each new EMA value blends the latest input with the previous EMA value. That is the smoothing part. Instead of letting every jagged close dominate the line, the EMA carries some memory of what came before.
For the examples later in this guide, I use the closing price. Some charting platforms let you choose another input, such as the typical price or adjusted close, but close is the cleanest starting point when you are learning the indicator.
Before the steps, here are the symbols used in the formulas:
C means the closing price.
t means the current bar.
t – 1 means the previous bar.
α, or alpha, is the EMA smoothing factor.
N is the lookback period chosen for the TRIX calculation.
A “bar” just means one chart interval. On a daily chart, the current bar is today and the previous bar is yesterday. On a 5-minute chart, the current bar is the latest 5-minute candle and the previous bar is the one before it. The TRIX logic is the same.
The same alpha value is used in each of the three EMA passes:
\alpha = \frac{2}{N + 1}
A smaller N gives more weight to recent data, so the EMA reacts faster. A larger N gives less weight to each new bar, so the line becomes slower and smoother.
Step 1: Smooth the closing price into EMA1
EMA1_t = \alpha C_t + (1 - \alpha)EMA1_{t-1}First EMA = current bar’s close blended with the previous bar’s first EMA
This first pass takes the raw closing price and turns it into a smoother EMA line.
Step 2: Smooth EMA1 into EMA2
EMA2_t = \alpha EMA1_t + (1 - \alpha)EMA2_{t-1}Second EMA = current bar’s first EMA blended with the previous bar’s second EMA
The second pass does not go back to the original price. It smooths the EMA1 series.
Step 3: Smooth EMA2 into EMA3
EMA3_t = \alpha EMA2_t + (1 - \alpha)EMA3_{t-1}Third EMA = current bar’s second EMA blended with the previous bar’s third EMA
The third pass smooths EMA2. At this point we have a heavily smoothed price series, but we do not yet have the TRIX line.
Step 4: Convert EMA3 into TRIX
TRIX_t = 100 \times \frac{EMA3_t - EMA3_{t-1}}{EMA3_{t-1}}TRIX = 100 × (current bar’s third EMA – previous bar’s third EMA) / previous bar’s third EMA
This final step is what turns the smoothed line into an oscillator. TRIX is not plotting EMA3 itself. It is plotting the percentage change in EMA3 from one bar to the next.
If the current EMA3 is higher than the previous EMA3, TRIX is positive. If the current EMA3 is lower than the previous EMA3, TRIX is negative. If the smoothed line is barely changing, TRIX will hover close to zero.
| Stage | What the calculation does | Trader translation |
|---|---|---|
| EMA1 | Smooths the closing price | First noise filter |
| EMA2 | Smooths EMA1 | Slower line |
| EMA3 | Smooths EMA2 | Triple-smoothed price series |
| TRIX | Measures the percentage change in EMA3 | Momentum of the smoothed series |
In Python, we will not calculate alpha by hand. Pandas handles it when we use ewm(span=lookback, adjust=False). The useful thing to remember is the sequence: close to EMA1, EMA1 to EMA2, EMA2 to EMA3, then EMA3 to TRIX.
What TRIX Is Good At
TRIX is mainly a trend-and-momentum filter. It is built to ignore some of the twitchier price movement that can make a normal chart hard to read.
That does not mean it removes risk or magically reveals the true trend. It means the indicator is deliberately slow. By the time TRIX turns, price has already moved enough to shift a triple-smoothed series.
That slower behaviour can be useful when you want confirmation rather than a hair-trigger entry. It can also be frustrating when the market reverses sharply and TRIX responds late.
I would not treat TRIX as a standalone trading system. I would treat it as a way to ask a narrower question: is the smoothed momentum behind this move improving, weakening, or doing nothing useful?
How Traders Read TRIX Signals
Most TRIX readings come down to three ideas: the zero line, a signal line, and divergence. None of them should be read mechanically. The same TRIX cross can be useful in a clean trend and useless in a choppy range.
Zero-line crosses
The zero line is the simplest reference point.
When TRIX moves above zero, the triple-smoothed EMA is rising compared with the previous bar. When TRIX moves below zero, the triple-smoothed EMA is falling.
A move above zero can support a bullish trend view. A move below zero can support a bearish trend view. I would use the word support deliberately here. A zero-line cross is not an automatic buy or sell instruction. It is a momentum confirmation signal.
Signal line crosses
Many traders add a signal line, usually an EMA of the TRIX line. A common setting is a 9-period EMA, although the best choice depends on the market and time frame being tested.
When TRIX crosses above its signal line, momentum is improving relative to its own recent average. When TRIX crosses below its signal line, momentum is weakening.
This is similar in spirit to how traders read signal-line crosses on MACD, although the calculations are different. TRIX has already gone through three EMA smoothing passes before the signal line is added, so it can feel cleaner but slower.
Divergence
Divergence appears when price and TRIX stop agreeing.
A bullish divergence forms when price makes a lower low but TRIX makes a higher low. That can suggest downside momentum is weakening.
A bearish divergence forms when price makes a higher high but TRIX makes a lower high. That can suggest upside momentum is weakening.
Divergence is easy to spot after the event and harder to trade in real time. I prefer to treat it as an early warning sign, not as a trigger by itself. Price still needs to confirm the turn.
A note on overbought and oversold readings
Some traders use TRIX to look for stretched momentum, but it is not bounded like RSI. There is no fixed upper or lower limit where TRIX must turn.
That makes static overbought and oversold levels risky. A strong trend can keep TRIX elevated or depressed for longer than expected. If you use TRIX extremes, it is usually better to compare the current reading with the same market’s own recent history rather than borrow a universal level from somewhere else.
| TRIX signal | What it shows | How I would read it |
|---|---|---|
| TRIX crosses above zero | Triple-smoothed momentum turns positive | Supports a bullish trend view |
| TRIX crosses below zero | Triple-smoothed momentum turns negative | Supports a bearish trend view |
| TRIX crosses above signal line | Momentum improves versus its recent average | Possible bullish confirmation |
| TRIX crosses below signal line | Momentum weakens versus its recent average | Possible bearish confirmation |
| Bullish divergence | Price makes a lower low while TRIX makes a higher low | Downside momentum may be fading |
| Bearish divergence | Price makes a higher high while TRIX makes a lower high | Upside momentum may be fading |
Choosing TRIX Settings
There is no universal best TRIX setting. A 14-period TRIX with a 9-period signal line is a reasonable starting point because many platforms and examples use something close to that structure, but it should not be treated as a magic number.
The word period means bars, not necessarily days. On a daily chart, a 14-period TRIX uses daily bars. On a 15-minute chart, it uses 15-minute bars. The calculation is the same, but the behaviour will feel very different.
The TRIX lookback period
The lookback period controls how quickly TRIX reacts.
A shorter lookback makes TRIX more sensitive. You will usually see earlier turns, more crosses, and more noise.
A longer lookback makes TRIX slower. You will usually see fewer signals, smoother movement, and more delay.
For day trading, shorter settings may make the chart feel more responsive, but that can also turn the indicator into a whipsaw machine. For swing trading or longer-term charts, a slower setting may be easier to read, but it can leave you late when the market turns quickly.
The signal-line setting
The signal line is usually an exponential moving average of the TRIX line. A 9-period EMA is a common default.
Shortening the signal line makes it react faster to TRIX changes. That can help if you want earlier confirmation, but it also increases the chance of twitchy crossovers.
Lengthening the signal line makes it slower. That can filter some of the smaller moves, but it may also confirm the trade after much of the easy move has already happened.
In the Python tutorial below, we will make both settings easy to change so you can see the difference on the chart rather than just read about it.
Testing settings without fooling yourself
It is easy to make an indicator setting look brilliant on one old chart. That does not mean it will survive contact with the next market regime.
If I were testing TRIX properly, I would start with three checks.
First, change the lookback and signal-line values slightly. If a strategy only works on one exact setting, it may be overfitted.
Second, test more than one market. A setting that behaves well on a slow index chart may be far too sleepy for a volatile single stock, crypto pair, or futures contract.
Third, separate the data used to choose the setting from the data used to judge it. That is the basic idea behind walk-forward testing. Optimising on the same data you use for the final verdict is a good way to flatter yourself with a backtest.
| Setting choice | What usually happens | Main risk |
|---|---|---|
| Shorter TRIX lookback | Faster turns and more signals | More whipsaws |
| Longer TRIX lookback | Smoother line and fewer signals | Later confirmation |
| Shorter signal line | Earlier TRIX crossovers | More false crosses |
| Longer signal line | Cleaner-looking crossovers | Slower entries and exits |
Using TRIX with Other Tools
TRIX can sit alongside other tools, but I would avoid piling on indicators that all measure the same thing. Three moving-average-style indicators can look like three confirmations when they are really three versions of the same price-smoothing idea.
A better pairing is often a different type of information. For example, you might compare TRIX momentum with a price breakout, a support-and-resistance level, volume behaviour, or a bounded oscillator such as RSI. RSI is useful as a comparison because it has fixed upper and lower limits, while TRIX does not.
TRIX Pros and Cons
TRIX is useful when you want a cleaner momentum read than raw price action gives you. The three smoothing passes can help remove some of the small, distracting moves that clutter a chart.
The same smoothing is also the weakness. TRIX can be late, especially after sharp reversals. By the time the indicator has crossed zero or crossed its signal line, price may already have moved a long way.
The other problem is range-bound price action. In a sideways market, TRIX can keep crossing back and forth without giving a tradeable move. This is where the indicator can look neat on a finished chart but feel irritating in live use.
I would use TRIX when I want to confirm trend momentum, compare momentum swings, or check whether a pullback is losing force. I would be much more careful using it as a standalone entry trigger.
| Strength | Why it helps |
|---|---|
| Filters some chart noise | Triple smoothing can make momentum easier to read |
| Works around a zero line | Positive and negative momentum are visually clear |
| Can be paired with a signal line | Gives traders a simple comparison against recent TRIX behaviour |
| Useful for divergence checks | Can show when smoothed momentum stops confirming price |
TRIX vs MACD: What Is the Difference?
Lets’ take a look at the similarities and differences of this indicator with the Moving Average Convergence Divergence (MACD), another TRIX is often compared with MACD because both indicators turn moving-average logic into a momentum tool. They can both use signal-line crosses, both can move above and below a centre line, and both can be used for divergence checks.
The calculations are different though.
MACD compares two exponential moving averages of price, usually a faster EMA minus a slower EMA. That gives traders a momentum line based on the gap between two smoothed price series.
TRIX takes a different route. It smooths the price three times, then measures the one-period percentage change of that final smoothed line. So instead of asking “how far apart are two moving averages?”, TRIX asks “is the triple-smoothed line rising or falling compared with the previous bar?”
In practice, MACD often feels more familiar and easier to interpret because many traders already know the MACD line, signal line and histogram. TRIX can feel cleaner on some charts because of the extra smoothing, but that same smoothing can make it later.
I would not say one is automatically better. If I want a familiar momentum tool with a histogram, I would usually reach for MACD first. If I want a slower, more filtered view of smoothed momentum, TRIX is worth testing.
| Indicator | Main calculation idea | What traders usually watch | Main weakness |
|---|---|---|---|
| TRIX | Percentage change of a triple-smoothed EMA | Zero-line crosses, signal-line crosses, divergence | Can react late because of triple smoothing |
| MACD | Difference between a fast EMA and a slow EMA | MACD line, signal line, histogram, divergence | Can whipsaw in choppy markets |
Quick TRIX Takeaways Before We Code
- TRIX is a momentum oscillator, not a moving average overlay.
- The indicator is built by smoothing price three times with exponential moving averages, then measuring the percentage change of the third EMA.
- A positive TRIX reading means the triple-smoothed series is rising. A negative reading means it is falling.
- The zero line, signal line and divergence are the main ways traders read TRIX.
- The extra smoothing can make TRIX cleaner than raw price action, but it also adds lag.
- TRIX is not bounded like RSI, so fixed overbought and oversold levels need care.
- The Python tutorial below builds the indicator from the same steps used in the formula: EMA1, EMA2, EMA3, percentage change, signal line, then chart.
Now we can build the indicator ourselves. The Python version below will download market data, calculate the three EMA passes, convert the third EMA into TRIX, add a signal line, and plot everything on a chart so you can see whether your output looks sensible.
Coding TRIX in Python and Plotting it on a Chart
Now we can build the TRIX indicator in Python.
I am going to keep this as a step-by-step tutorial rather than throwing one large script at you. That way you can see how each piece works: downloading the data, calculating the three EMA passes, turning the third EMA into TRIX, adding the signal line, and finally plotting the chart.
If you are not a regular Python user, do not worry if some of the syntax looks unfamiliar at first. Copy each python-labelled block into the same file as we go, save it, and by the end you should have a chart similar to the one shown later in this section.
Step 1: Install Visual Studio Code and the Python extension
This guide assumes you have Python installed on your computer. If you do not, download it from the official Python website first.
For the editor, I am using Visual Studio Code. It is free, widely used, and more than enough for small trading scripts like this.
Once VS Code is open:
- Click the Extensions icon on the left sidebar, or press Ctrl+Shift+X.
- Search for Python.
- Install the Python extension from Microsoft.
- Restart VS Code if it asks you to.
Step 2: Install the Python libraries
Before we write the script, we need to install the Python libraries it uses.
yfinance downloads the market data.
pandas stores the data in a table and calculates the EMAs.
mplfinance creates the candlestick chart.
matplotlib lets us add a cleaner custom legend to the TRIX panel.
Open a new terminal in VS Code by clicking Terminal > New Terminal, then run:
python -m pip install yfinance pandas mplfinance matplotlibIf you are on Windows and that command does not work, try:
py -m pip install yfinance pandas mplfinance matplotlibStep 3: Create a New Python File
Create a new file in VS Code and save it as:
trix_indicator.py
All the code blocks below go into this same file. Add them in order from top to bottom.
Step 4: Import the libraries
At the top of the file, we import the libraries the script needs:
import pandas as pd
import yfinance as yf
import mplfinance as mpf
from matplotlib.lines import Line2DHere is what each line does:
import pandas as pd brings in pandas, which we use for the data table and the EMA calculations.
import yfinance as yf brings in yfinance, which downloads historical market data from Yahoo Finance.
import mplfinance as mpf brings in mplfinance, which draws the candlestick chart.
from matplotlib.lines import Line2D gives us a simple way to build a custom legend for the TRIX line, signal line, and zero line.
Step 5: Add the settings
Next, add a small settings section. Keeping these values near the top of the file makes the script easier to customise later.
ticker = "^RUT"
chart_title = "Russell 2000"

start_date = "2025-05-01"
end_date = "2026-05-01"

trix_period = 14
signal_period = 9
ticker is the Yahoo Finance symbol we want to download. Here I am using ^RUT, which is the Russell 2000 index.
chart_title is the name we want to show on the chart.
start_date and end_date control the section of history we download.
trix_period controls the lookback used for the three EMA passes. This becomes the lookback value inside our TRIX function.
signal_period controls the EMA used for the TRIX signal line.
These settings are not sacred. Later, you can change ^RUT to another ticker, adjust the date range, or test different TRIX and signal-line periods.
The dates use YYYY-MM-DD format. In practice, yfinance treats the end date as the cut-off, so if you want to include the most recent available bar you can push the end date one trading day later.
Step 6: Define the TRIX calculation function
Now we define the function that calculates TRIX. A function is just a reusable block of code. Instead of writing the same EMA steps over and over, we put them in one place and call the function when we need it.
def calculate_trix(close, lookback=14, signal_period=9):
    # First EMA pass: smooth the closing price
    ema1 = close.ewm(span=lookback, adjust=False).mean()

    # Second EMA pass: smooth EMA1
    ema2 = ema1.ewm(span=lookback, adjust=False).mean()

    # Third EMA pass: smooth EMA2
    ema3 = ema2.ewm(span=lookback, adjust=False).mean()

    # TRIX is the percentage change of the third EMA
    trix = 100 * ema3.pct_change()

    # The signal line is an EMA of TRIX
    signal = trix.ewm(span=signal_period, adjust=False).mean()

return trix, signalThis function takes one input called close, which is the closing-price column from our market data.
The first three calculation lines are the three smoothing passes:
ema1 smooths the closing price.
ema2 smooths ema1, rather than going back to the raw closing price.
ema3 smooths ema2, giving us the triple-smoothed series used by TRIX.
The span=lookback part is where the code connects back to the alpha formula. Earlier, we used N for the lookback period in α = 2 / (N + 1). In this script, lookback plays that role. Because lookback is set to 14, pandas calculates each EMA pass using a 14-period span.
The adjust=False part makes pandas calculate the EMA in the recursive style traders usually expect: the current EMA value is based on the current input and the previous EMA value.
Once the three EMA passes are complete, this line calculates TRIX:
trix = 100 * ema3.pct_change()
pct_change() compares the current EMA3 value with the previous EMA3 value. Multiplying by 100 turns that change into a percentage.
That matches the formula from earlier in the guide:
TRIX = 100 × (current bar’s third EMA – previous bar’s third EMA) / previous bar’s third EMA
The signal line is then calculated as an EMA of TRIX itself. It is not part of the basic TRIX calculation, but traders often add it so they can compare TRIX with its own recent average.
Finally, return trix, signal sends both lines back to the rest of the script so we can add them to the chart later.
Step 7: Download the market data
Next we download the market data using yfinance. Add this below the TRIX function:
data = yf.download(
    ticker,
    start=start_date,
    end=end_date,
    auto_adjust=True,
    progress=False,
    multi_level_index=False
)
This downloads the open, high, low, close, and volume data for the ticker and date range we set earlier.
auto_adjust=True means yfinance adjusts the price data for events such as dividends and splits where applicable.
progress=False stops yfinance from printing an unnecessary download progress bar.
multi_level_index=False helps keep the downloaded table simple, with normal column names such as Open, High, Low, Close, and Volume.
Then add a small safety check:
if data.empty:
    raise RuntimeError("No data was downloaded. Check the ticker symbol and date range.")
This check gives us a clearer error message if the ticker is wrong, the date range is invalid, or the download fails.
Step 8: Calculate TRIX and the signal line
Now that we have price data, we can calculate the TRIX line and the signal line.
Add this below the code for the data download and empty-data check:
data["TRIX"], data["Signal"] = calculate_trix(
    data["Close"],
    lookback=trix_period,
    signal_period=signal_period
)This line calls the calculate_trix() function we wrote earlier.
data["Close"] gives the function the closing-price series.
lookback=trix_period tells it to use the TRIX lookback setting from the top of the script.
signal_period=signal_period tells it to use our signal-line setting.
The two results are then added to the data table as new columns called TRIX and Signal.
If you are new to pandas, think of data as a spreadsheet. We started with columns such as Open, High, Low, Close and Volume. Now we have added two more columns: TRIX and Signal.
Step 9: Add the zero line
TRIX is read around a zero line, so we will add a column filled with zero. This makes it easy to plot the reference line later.
data["Zero Line"] = 0Every row in this new column has the value 0. When we plot it, it becomes the dashed horizontal line that TRIX moves above and below.
We also remove the first blank TRIX values before plotting. Those blanks appear because TRIX needs earlier EMA values before it can calculate properly.
plot_data = data.dropna(subset=["TRIX", "Signal"])dropna() removes rows where TRIX or the signal line is missing. This keeps the chart cleaner and avoids plotting errors.
Step 10: Define the TRIX chart lines
Next we tell mplfinance which extra lines to draw under the price chart.
trix_plots = [
    mpf.make_addplot(
        plot_data["TRIX"],
        panel=2,
        color="blue",
        width=1.2,
        ylabel="TRIX (%)"
    ),
    mpf.make_addplot(
        plot_data["Signal"],
        panel=2,
        color="red",
        width=1.0
    ),
    mpf.make_addplot(
        plot_data["Zero Line"],
        panel=2,
        color="black",
        linestyle="--",
        width=0.8
    )
]This block creates three extra chart lines.
The blue line is TRIX.
The red line is the signal line.
The black dashed line is the zero line.
The panel=2 setting tells mplfinance to place these lines in the lower indicator panel, below price and volume.
The panel numbering can look a little strange at first. In this chart, the main price panel is at the top, volume sits below it, and the TRIX panel is placed underneath those.
Step 11: Create the chart
Now we can create the candlestick chart and add the TRIX panel underneath it.
fig, axes = mpf.plot(
    plot_data,
    type="candle",
    style="yahoo",
    volume=True,
    addplot=trix_plots,
    panel_ratios=(3, 1, 1.4),
    title=f"{chart_title} with TRIX ({trix_period}, {signal_period})",
    figsize=(11, 7),
    returnfig=True
)

# Give the chart some breathing room so the right-hand y-axis labels
# and angled date labels are not clipped.
fig.subplots_adjust(
    left=0.07,
    right=0.90,
    top=0.92,
    bottom=0.16,
    hspace=0.05
)This is the main chart command.
type="candle" gives us a candlestick chart.
style="yahoo" uses a familiar chart style.
volume=True adds the volume panel.
addplot=trix_plots adds the TRIX, signal and zero-line plots we created in the previous step.
panel_ratios controls the relative size of the price, volume and TRIX panels.
returnfig=True lets us access the figure and axes afterwards, which we need for the custom legend.
The subplots_adjust() block gives the finished chart some extra breathing room. Without it, the right-hand y-axis labels can sit too close to the edge of the chart window, especially on Windows or when the chart opens in a smaller viewer.
Finally, add a cleaner legend to the TRIX panel:
trix_axis = axes[4] if len(axes) > 4 else axes[-1]

legend_items = [
    Line2D([], [], color="blue", label=f"TRIX {trix_period}"),
    Line2D([], [], color="red", label=f"Signal {signal_period}"),
    Line2D([], [], color="black", linestyle="--", label="Zero line")
]

trix_axis.legend(handles=legend_items, loc="upper left")mplfinance creates several chart axes behind the scenes. The trix_axis line grabs the lower TRIX panel so we can place the legend there.
Line2D is only being used to create neat legend labels. It does not change the TRIX calculation.
Add the final line to display the chart:
mpf.show()This opens the finished chart window.
Step 12: Run the Python script
Now save the file and run it.
First, save trix_indicator.py by pressing Ctrl+S in VS Code.
The easiest way is usually to click the play button in the top-right corner of VS Code. If that works, the script should run and the chart window should open.
You can also run the script from the terminal.
In VS Code, open Terminal > New Terminal. Then move into the folder where you saved the file. For example, if you saved it in a folder called python_scripts on your Desktop, you might type:
cd Desktop/python_scriptsOnce you are in the correct folder, run:
python trix_indicator.pyOn some Windows setups, this version works instead:
py trix_indicator.pyIf everything has been pasted in the right order, a chart window should open with the Russell 2000 candlestick chart, volume, and the TRIX panel underneath.
It ought to look like mine shown here:
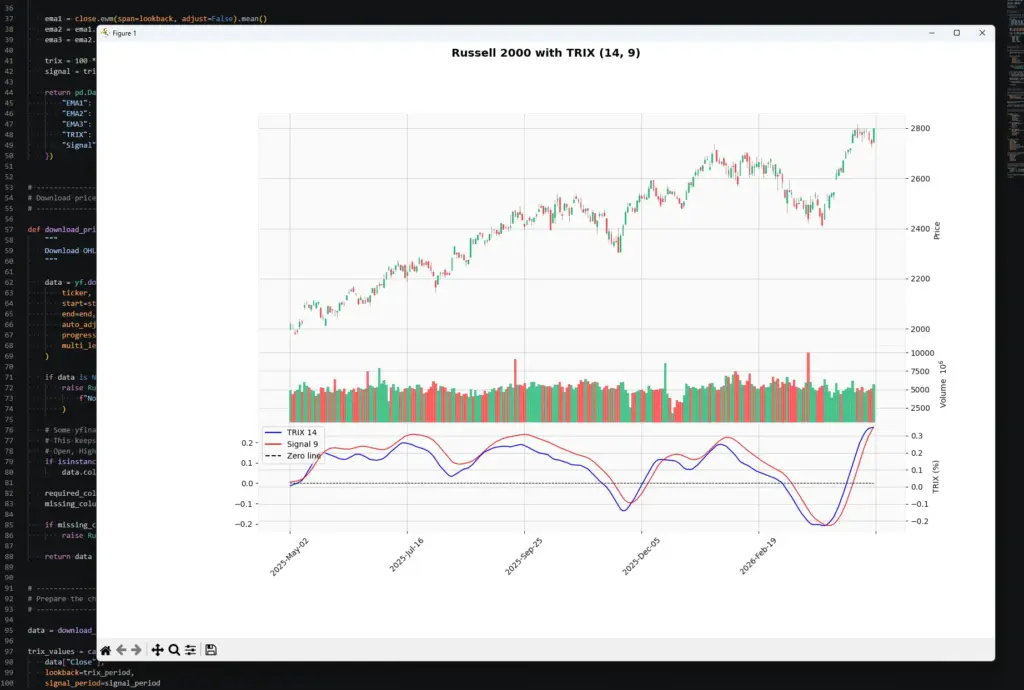
The exact shape of your TRIX line depends on the ticker, date range, TRIX period and signal-line period. What matters at this stage is that the indicator appears in the lower panel and moves around the zero line.
Step 13: Customise the script
Once the script works, the useful part begins: changing the inputs and seeing how the chart reacts.
To change the market, edit the ticker near the top of the file:
ticker = "^RUT"
chart_title = "Russell 2000"For example, you could change the ticker and chart title to another Yahoo Finance symbol:
ticker = "SPY"
chart_title = "SPDR S&P 500 ETF"To change the date range, edit:
start_date = "2025-05-01"
end_date = "2026-05-01"To change the TRIX lookback or signal-line period, edit:
trix_period = 14
signal_period = 9Try changing one setting at a time. For example, compare a 10-period TRIX with a 20-period TRIX on the same chart. The shorter setting should react faster. The longer setting should look smoother but slower.
Further Reading
For the TRIX indicator itself, the most useful historical reference is Jack K. Hutson’s original “Good TRIX” work from Technical Analysis of Stocks & Commodities. Hutson described TRIX as triple exponential smoothing followed by a momentum reading, which is the key idea behind the indicator used in this guide.
CQG’s TRIX help page is also worth reading because it gives a practical charting-platform explanation of the indicator and cites Hutson’s July/August 1983 Stocks & Commodities article.
For a broader indicator reference, “Technical Analysis from A to Z” by Steven B. Achelis: Published by McGraw Hill; 2nd edition (January 13, 2001) is still a useful catalogue-style book. It covers a wide range of technical analysis tools, including the TRIX indicator and is better suited to quick reference than to trading-system design.