
Updated May 2026: I’ve refreshed this Parabolic SAR guide with a clearer formula explanation, more practical notes on trailing stops and whipsaws, and an updated Python chart tutorial for readers who want to build the indicator step by step.
What Is the Parabolic SAR Indicator?
Parabolic SAR stands for Parabolic Stop and Reverse. It is a trend-following indicator that plots dots above or below price.
When the dots are below price, the indicator is usually treating the market as being in an uptrend. When the dots are above price, it is treating the market as being in a downtrend.
The dots also behave like a trailing stop. In an uptrend, they rise beneath price. In a downtrend, they fall above price. If price crosses the dots, the indicator flips to the other side.
That flip is why traders watch Parabolic SAR for possible trend changes, exits, and trailing stop levels. I would not treat every flip as a clean trade signal. In a choppy market, the dots can switch sides repeatedly and produce a lot of whipsaws.
In this guide I’ll walk through where Parabolic SAR came from, how the formula works, how traders use it for trend following and trailing stops, and how to build the indicator in Python step by step.
How Parabolic SAR Works on a Chart
The easiest way to understand Parabolic SAR is to look at the dots.
In a rising market, the dots usually sit below the candles. As price moves higher, the dots climb behind it. Traders often use that rising dot line as a trailing stop reference.
In a falling market, the dots usually sit above the candles. As price moves lower, the dots follow from above.
The “stop and reverse” part comes from what happens when price crosses the dot level. The indicator flips to the other side of price and begins tracking the new direction.
That sounds tidy, but the chart will not always behave tidily. Parabolic SAR tends to work best when price is trending cleanly. In sideways markets, price can keep crossing the dots without producing a useful trend.
Where Parabolic SAR Comes From
Parabolic SAR was developed by J. Welles Wilder Jr. and published in his 1978 book New Concepts in Technical Trading Systems. The same book introduced several other well-known technical indicators, including RSI, ATR and ADX.
Wilder’s idea was to create a systematic way to follow a trend and trail a stop as the trend developed. That is why the indicator is called Stop and Reverse. It was not only designed to mark trend direction. It was also designed to show when the prior trend-following position should be stopped and potentially reversed.
That background is worth knowing because Parabolic SAR is often misunderstood. It is not mainly an overbought or oversold tool. It is closer to a trailing stop and trend-following system.
The weakness follows from that design. A trend-following stop can be useful when price is moving directionally, but it can become irritating when price chops sideways.
How Parabolic SAR Is Calculated
Parabolic SAR is more awkward than a simple oscillator because each dot depends on the previous dot. That is why the indicator has a “stepping” feel. It keeps updating as the trend develops.
The basic idea is that the SAR dot moves toward the trend’s extreme point. In an uptrend, the extreme point is the highest high made during that trend. In a downtrend, the extreme point is the lowest low made during that trend.
Before the formulas, here are the terms:
SAR means Stop and Reverse.
SAR_t means the current SAR value.
SAR_{t+1} means the next SAR value.
EP means Extreme Point.
AF means Acceleration Factor.
The usual starting AF is 0.02. It then increases as the trend makes new extremes, often up to a maximum of 0.20.
Uptrend formula
SAR_{t+1} = SAR_t + AF \times (EP - SAR_t)Next SAR = current SAR + acceleration factor × (extreme point – current SAR)
In an uptrend, the SAR dot is below price and moves upward toward the highest high of the trend.
If price keeps making new highs, the extreme point updates and the acceleration factor usually increases. That pulls the SAR dot closer to price. This is why Parabolic SAR can start slowly and then tighten quickly as a trend develops.
Downtrend formula
SAR_{t+1} = SAR_t - AF \times (SAR_t - EP)Next SAR = current SAR – acceleration factor × (current SAR – extreme point)
In a downtrend, the SAR dot is above price and moves downward toward the lowest low of the trend.
If price keeps making new lows, the extreme point updates and the acceleration factor usually increases. The dots then move closer to price from above.
| Component | What it means | Trader translation |
|---|---|---|
| SAR | Stop and Reverse value | The dot level plotted on the chart |
| EP | Extreme Point | Highest high in an uptrend or lowest low in a downtrend |
| AF | Acceleration Factor | Controls how quickly SAR moves toward price |
| Maximum AF | Cap on acceleration | Stops the dots tightening too aggressively |
The acceleration factor is the part beginners usually miss. A higher AF makes the SAR dots move closer to price more quickly. That can help lock in more of a trend, but it can also make the indicator flip sooner.
A lower AF gives price more room. That can reduce some whipsaws, but it also means the trailing dot may sit farther away from price.
I would treat 0.02 and 0.20 as default test settings, not as sacred numbers. A clean trend, a slow drift and a sideways chop can all make the same Parabolic SAR settings behave very differently.
There is also an important practical rule in most Parabolic SAR implementations. In an uptrend, the SAR value is normally kept below recent lows. In a downtrend, it is normally kept above recent highs. This prevents the dot from jumping inside recent price action before a real stop-and-reverse event.
You do not need to memorise every implementation detail to use the indicator, but it helps to understand the shape. Parabolic SAR is not just drawing random dots. It is building a trailing stop that accelerates as the trend extends.
How Traders Use Parabolic SAR
Parabolic SAR is mainly used in three ways: trend direction, trailing stops, and possible stop-and-reverse points.
If I were teaching Parabolic SAR to a new trader, I’d start with the trailing stop use case before talking about entry signals.
Using the dots for trend direction
When the dots are below price, Parabolic SAR is usually treating the market as being in an uptrend.
When the dots are above price, it is usually treating the market as being in a downtrend.
That makes the indicator visually simple. You do not need to calculate anything by hand while looking at the chart. The dots show which side of price the indicator is tracking.
The danger is assuming that every dot flip marks the start of a clean new trend. In a strong trend, the dots can be helpful. In a choppy range, they can flip from one side to the other without giving much useful information.
Using Parabolic SAR as a trailing stop
This is usually the most practical way to start using the indicator.
In an uptrend, the SAR dots rise beneath price. A trader who is already long may use those dots as a trailing stop guide. If price keeps rising, the stop can move up behind it.
In a downtrend, the dots fall above price. A trader who is short may use the dots as a trailing stop from above.
This does not mean every trader should place a stop exactly on the dot. Markets gap, spreads widen, and some instruments trade noisily around obvious levels. But the dot gives a structured reference point instead of letting the stop decision become emotional.
Using dot flips as possible entry or exit signals
A dot flip happens when the SAR switches from one side of price to the other.
If the dots move from above price to below price, the indicator has flipped to an upward trend state. If the dots move from below price to above price, it has flipped to a downward trend state.
Some traders use those flips as entry or exit signals. I would be careful with that approach. A flip can mark a real change in trend, but it can also be a whipsaw if price is moving sideways.
For me, a dot flip is a prompt to inspect the chart, not a command to trade. I would want to know whether price is breaking out, whether a moving average or ADX confirms trend strength, and whether the risk level makes sense.
Combining Parabolic SAR with other indicators
Parabolic SAR usually works better when it is paired with a tool that answers a different question.
A moving average can help define the broader trend. ADX can help judge whether the market is trending strongly enough for a trend-following tool. ATR can help with volatility-aware stop placement. MACD or RSI can add momentum context.
That does not mean adding five indicators to the chart. It means giving each tool a job.
For example, a trader might only take bullish Parabolic SAR flips when price is above a rising moving average, or only pay attention to SAR signals when ADX suggests the market has enough trend strength.
| Parabolic SAR use | What it helps with | Main warning |
|---|---|---|
| Dots below price | Shows the indicator is tracking an uptrend | Can flip falsely in ranges |
| Dots above price | Shows the indicator is tracking a downtrend | Can lag after sharp turns |
| Trailing stop guide | Gives a structured stop reference | The dot may be too tight for noisy markets |
| Dot flip | Warns that the trend state has changed | Not an automatic entry signal |
| Combined with ADX or moving averages | Adds trend-strength or trend-direction context | Too many filters can overcomplicate the setup |
Before we code it, it is worth looking at the main strengths and weaknesses. Parabolic SAR can look excellent in a clean trend and frustrating in a sideways market, so bear in mind the pros and cons.
Parabolic SAR Pros and Cons
Understanding the strengths and weaknesses of the indicator can help you make the most of this tool when deciding how to use Parabolic SAR in a strategy
Parabolic SAR is useful because it is easy to see. The dots sit above or below price, so the indicator gives a quick visual read on the trend state.
Its best use is often as a trailing stop guide. In a clean trend, the dots can help a trader stay with the move while gradually tightening the stop.
The weakness is that Parabolic SAR does not know whether the market is trending or ranging. In sideways price action, the dots can flip above and below price several times without a useful move developing.
That is why I would be careful using it as a standalone entry system. A dot flip can be a useful warning, but it still needs chart context.
| Strength | Why it helps |
|---|---|
| Easy to read | Dots below price suggest an uptrend; dots above price suggest a downtrend |
| Useful trailing stop guide | Gives a structured level to trail behind price |
| Reacts as the trend extends | The acceleration factor tightens the dots as new extremes are made |
| Works across markets and time frames | Can be applied to stocks, futures, forex, crypto or indices |
| Helps remove some discretion | Gives a rule-based reference instead of emotional stop placement |
| Weakness | Why it matters |
|---|---|
| Whipsaws in sideways markets | Dot flips can happen repeatedly without a real trend |
| Can confirm late | A useful part of the move may already have happened |
| Sensitive to settings | Faster settings can flip too often; slower settings can lag |
| Not a full trade plan | Trend state alone does not define risk, target or context |
| Can sit too close in noisy markets | Stops placed exactly on the dot may be too tight |
Quick Parabolic SAR Takeaways Before We Code
- Parabolic SAR stands for Parabolic Stop and Reverse.
- The indicator plots dots above or below price.
- Dots below price usually show an uptrend state.
- Dots above price usually show a downtrend state.
- The dots can be used as a trailing stop guide.
- A dot flip can warn that the trend state has changed.
- Dot flips are not automatic entry signals.
- Parabolic SAR usually works better in trending markets than in sideways markets.
- The acceleration factor controls how quickly the dots move toward price.
- The Python tutorial below calculates the dots and plots them on a candlestick chart.
Now we can build the indicator ourselves. The Python section below follows the same logic: calculate the SAR dots, plot them around price, and then inspect how the dots behave in both trending and choppy sections of the chart.
Coding the Parabolic SAR in Python
I am going to keep this as a step-by-step tutorial rather than dropping in one large script. Each Python-labelled block goes into the same file, in order. By the end, we will have downloaded market data, calculated the Parabolic SAR dots, and plotted them over a candlestick chart.
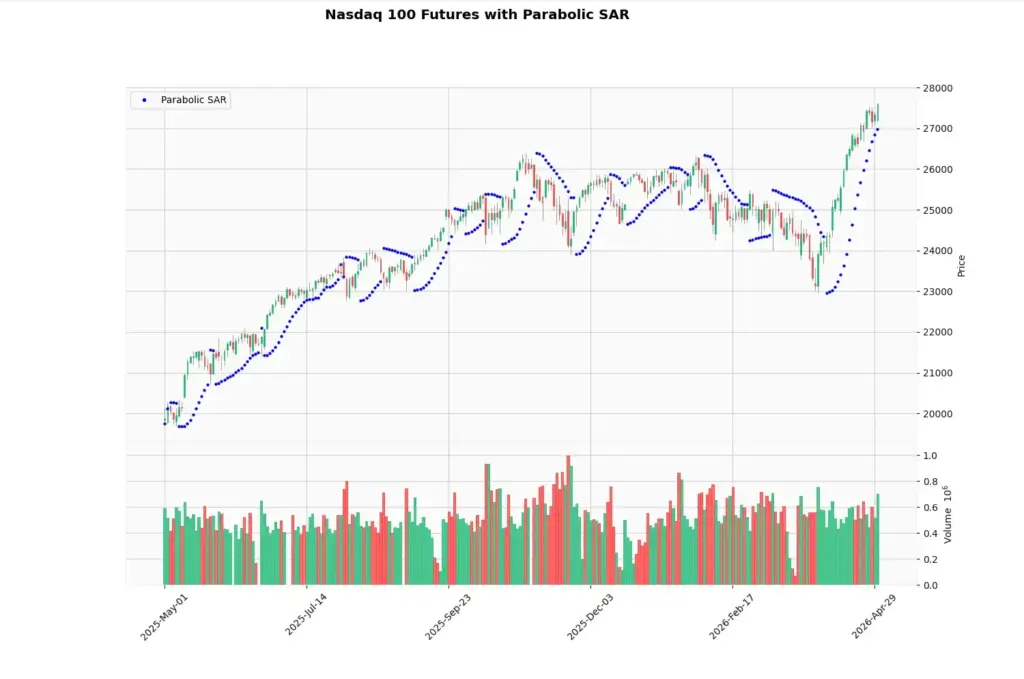
For this example I use Nasdaq 100 futures data from Yahoo Finance. In yfinance, the symbol NQ=F pulls the Yahoo Finance Nasdaq 100 futures series.
For live trading or serious backtesting, I would still use broker or exchange-quality futures data. Yahoo/yfinance is useful for a tutorial chart, but futures contracts roll, data can be delayed, and the symbol may behave more like a continuous front-contract series than a carefully constructed institutional back-adjusted futures history.
Step 1: Install the Python libraries
This guide assumes you already have Python installed and are using Visual Studio Code.
Open a terminal in VS Code by clicking Terminal > New Terminal, then run:
python -m pip install yfinance pandas mplfinance matplotlib
On some Windows machines, this version works instead:
py -m pip install yfinance pandas mplfinance matplotlibStep 2: Create the file and import the libraries
Create a new Python file and save it as:
parabolic_sar.py
At the top of the file, add:
import pandas as pd
import yfinance as yf
import mplfinance as mpf
from matplotlib.lines import Line2Dpandas stores the market data in a table and lets us work with the high, low and close columns.
yfinance downloads the market data.
mplfinance draws the candlestick chart.
Line2D lets us create a clean legend for the Parabolic SAR dots.
Step 3: Add the settings
Next, add a small settings section. Keeping these values near the top makes the script easier to change later.
ticker = "NQ=F"
chart_title = "Nasdaq 100 Futures"

start_date = "2025-05-01"
end_date = "2026-05-01"

acceleration_factor = 0.02
max_acceleration_factor = 0.20
ticker is the Yahoo Finance symbol.
chart_title is the title that will appear on the chart.
The dates use YYYY-MM-DD format. yfinance treats the end date as a cut-off, so you can push it one trading day later if you want to include the most recent available bar.
acceleration_factor controls how quickly the dots move toward price as the trend develops.
max_acceleration_factor caps that acceleration so the dots do not tighten without limit.
Step 4: Define the Parabolic SAR function
Now define the function that calculates the Parabolic SAR dots.
This is longer than the earlier indicator functions because Parabolic SAR is state-based. Each dot depends on the prior dot, the current trend direction, the extreme point and the acceleration factor.
def calculate_parabolic_sar(data, step=0.02, max_step=0.20):
    high = data["High"]
    low = data["Low"]

    sar = pd.Series(index=data.index, dtype="float64")
    trend = pd.Series(index=data.index, dtype="object")

    # Start with a simple assumption. If the second close is higher than
    # the first close, begin in an uptrend. Otherwise begin in a downtrend.
    uptrend = data["Close"].iloc[1] >= data["Close"].iloc[0]

    if uptrend:
        sar.iloc[0] = low.iloc[0]
        ep = high.iloc[0]
        trend.iloc[0] = "up"
    else:
        sar.iloc[0] = high.iloc[0]
        ep = low.iloc[0]
        trend.iloc[0] = "down"

    af = step

    for i in range(1, len(data)):
        prior_sar = sar.iloc[i - 1]

        if uptrend:
            # Move SAR upward toward the extreme point
            current_sar = prior_sar + af * (ep - prior_sar)

            # Keep SAR below recent lows where possible
            if i >= 2:
                current_sar = min(current_sar, low.iloc[i - 1], low.iloc[i - 2])
            else:
                current_sar = min(current_sar, low.iloc[i - 1])

            # Reversal: price trades below SAR
            if low.iloc[i] < current_sar:
                uptrend = False
                current_sar = ep
                ep = low.iloc[i]
                af = step
                trend.iloc[i] = "down"
            else:
                # Trend continues. Update EP and AF if a new high is made.
                if high.iloc[i] > ep:
                    ep = high.iloc[i]
                    af = min(af + step, max_step)
                trend.iloc[i] = "up"

        else:
            # Move SAR downward toward the extreme point
            current_sar = prior_sar + af * (ep - prior_sar)

            # Keep SAR above recent highs where possible
            if i >= 2:
                current_sar = max(current_sar, high.iloc[i - 1], high.iloc[i - 2])
            else:
                current_sar = max(current_sar, high.iloc[i - 1])

            # Reversal: price trades above SAR
            if high.iloc[i] > current_sar:
                uptrend = True
                current_sar = ep
                ep = high.iloc[i]
                af = step
                trend.iloc[i] = "up"
            else:
                # Trend continues. Update EP and AF if a new low is made.
                if low.iloc[i] < ep:
                    ep = low.iloc[i]
                    af = min(af + step, max_step)
                trend.iloc[i] = "down"

        sar.iloc[i] = current_sar

    return sar, trend
The function returns two things.
The first is the SAR value, which becomes the dots on the chart.
The second is the trend state, which tells us whether the dot belongs to an uptrend or downtrend phase.
The code also includes the practical constraint mentioned earlier. In an uptrend, the SAR is kept below recent lows where possible. In a downtrend, it is kept above recent highs. This helps stop the dot from jumping inside recent price action too early.
Step 5: Download the market data
Now download the price data.
data = yf.download(
    ticker,
    start=start_date,
    end=end_date,
    auto_adjust=True,
    progress=False,
    multi_level_index=False
)

if data.empty:
    raise RuntimeError("No data was downloaded. Check the ticker symbol and date range.")

if isinstance(data.columns, pd.MultiIndex):
    data.columns = data.columns.get_level_values(0)

data.index = pd.DatetimeIndex(data.index)
This downloads open, high, low, close and volume data.
auto_adjust=True keeps the price data adjusted where applicable.
progress=False removes the download progress bar.
multi_level_index=False keeps the columns easier to work with.
The final line makes sure the index is treated as dates, which mplfinance expects when plotting.
Step 6: Calculate the Parabolic SAR
Now we call the function we made in Step 4 and add the SAR values to our data table.
data["SAR"], data["Trend"] = calculate_parabolic_sar(
    data,
    step=acceleration_factor,
    max_step=max_acceleration_factor
)

plot_data = data.dropna(subset=["SAR"])Think of data as a spreadsheet. It already has columns such as Open, High, Low, Close and Volume. This step adds the SAR dots and the trend state as new columns.
dropna() removes early blank values before plotting.
Step 7: Define the Parabolic SAR plot
Next we tell mplfinance how to draw the SAR dots.
sar_plot = [
    mpf.make_addplot(
        plot_data["SAR"],
        type="scatter",
        marker=".",
        markersize=18,
        color="blue",
        panel=0,
        ylabel="Price"
    )
]type="scatter" tells mplfinance to draw dots rather than a continuous line.
panel=0 places the dots on the main price chart.
The dots are blue in this example so they stand out from the candlesticks.
Step 8: Create the chart
fig, axes = mpf.plot(
    plot_data,
    type="candle",
    style="yahoo",
    volume=True,
    addplot=sar_plot,
    title=f"{chart_title} with Parabolic SAR",
    figsize=(11, 7),
    returnfig=True
)

fig.subplots_adjust(
    left=0.07,
    right=0.90,
    top=0.92,
    bottom=0.16,
    hspace=0.05
)type="candle" gives us the candlestick chart.
volume=True adds the volume panel.
addplot=sar_plot adds the Parabolic SAR dots.
subplots_adjust gives the chart extra breathing room so the right-hand labels and angled dates are not clipped.
Step 9: Add the legend and show the chart
Finally, add a legend and show the chart.
price_axis = axes[0]

legend_items = [
    Line2D([], [], color="blue", marker=".", linestyle="None", label="Parabolic SAR")
]

price_axis.legend(handles=legend_items, loc="upper left")

fig.savefig("parabolic_sar_chart.png", dpi=150, bbox_inches="tight")

mpf.show()fig.savefig() saves the chart as a PNG image in the same folder as the script.
mpf.show() opens the chart window.
Step 10: Run the script
Save parabolic_sar.py by pressing Ctrl+S.
The easiest route is usually to click the play button in the top-right corner of VS Code. If that works, the chart window should open.
You can also run it from the terminal. Open Terminal > New Terminal, move into the folder where you saved the script, then run:
python parabolic_sar.pyOn some Windows setups, use:
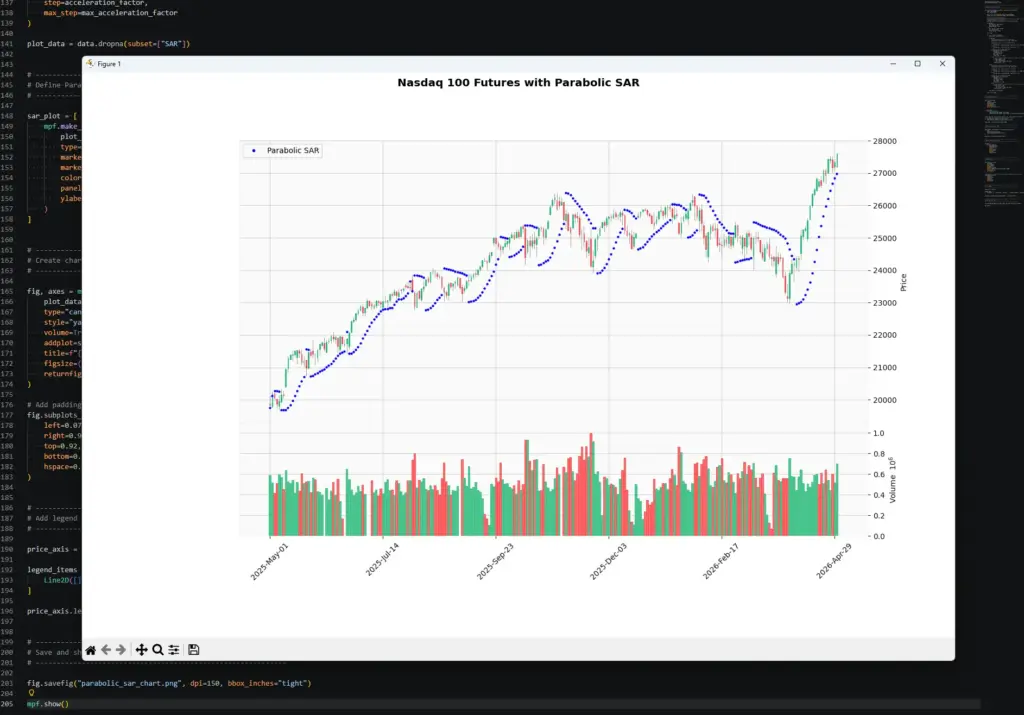
py parabolic_sar.pyYour chart should show NQ=F candlesticks with volume underneath and blue Parabolic SAR dots above or below price. The exact pattern will depend on the ticker, date range and settings you choose. Here’s mine:
Once the script works, try changing the inputs.
To change the market, edit:
ticker = "NQ=F"
chart_title = "Nasdaq 100 Futures"To change the date range, edit:
start_date = "2025-05-01"
end_date = "2026-05-01"To change the Parabolic SAR sensitivity, edit:
acceleration_factor = 0.02
max_acceleration_factor = 0.20Parabolic SAR Strategy Examples and Common Mistakes
The examples below are better treated as chart-reading situations than perfect trade case studies. Parabolic SAR can look excellent in a clean trend and frustrating in a sideways market.
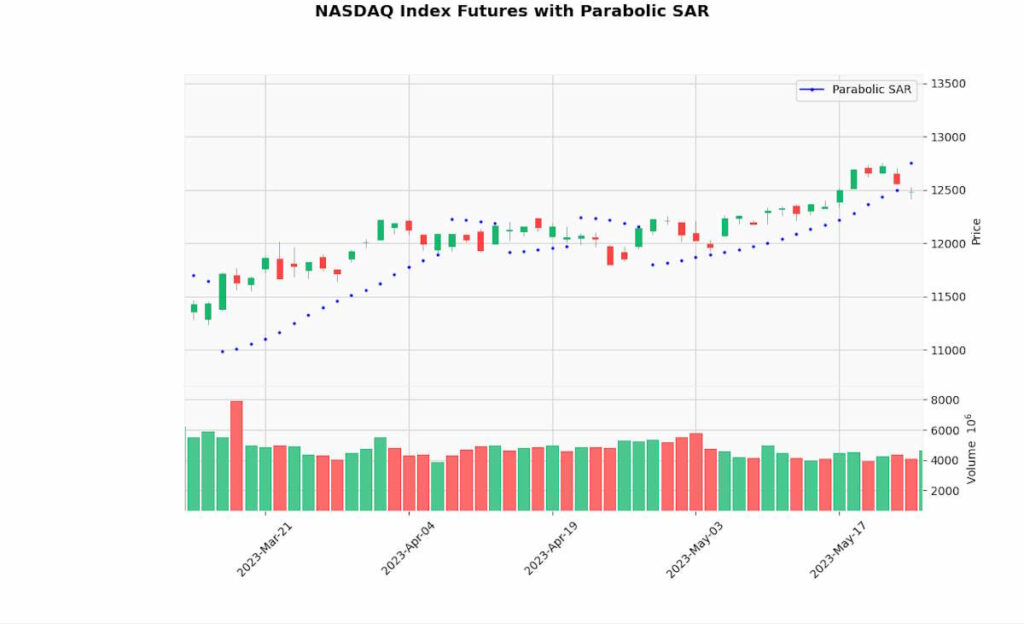
Example 1: A clean trend
In a clean uptrend, the Parabolic SAR dots often stay below price and climb behind the move. That is where the indicator can be useful.
A trader already in the position might use the dots as a trailing stop guide. As price rises, the dots rise too, giving the trader a structured way to tighten risk.
The important point is that the dot is not predicting the next candle. It is trailing the move. If price keeps trending, that can be helpful. If price suddenly reverses, the dot flip comes after price has already moved enough to trigger it.
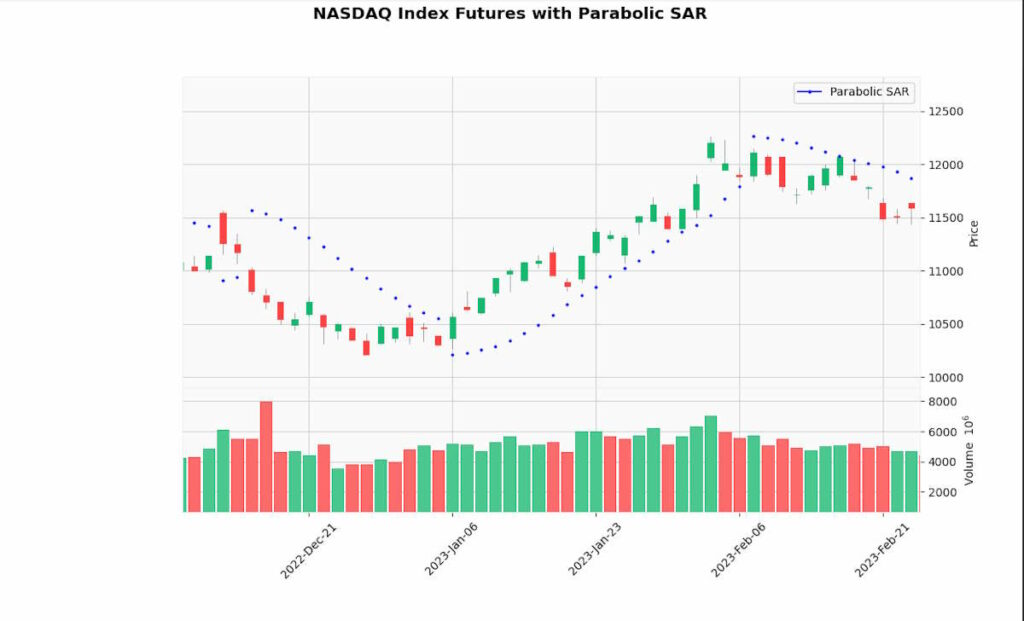
Example 2: A sideways market
This is where Parabolic SAR can become frustrating.
In a sideways market, price may keep crossing the SAR dots without starting a real trend. The indicator flips from one side to the other, but price does not follow through.
A trader treating every flip as an entry can get churned in and out. That does not mean the indicator is useless. It means the market condition is wrong for that style of signal.
When I see repeated dot flips in a tight range, I would usually stop treating Parabolic SAR as an entry tool and switch to asking whether the market is range-bound, waiting for news, or building pressure for a later breakout.
The main takeaway is that Parabolic SAR is a trend-following tool. It is at its best when price is moving directionally. It struggles when price is drifting sideways.
That is why I would combine it with market structure, trend filters, ADX, moving averages, ATR, or price action rather than asking the dots to do everything.
Frequently Asked Questions
Q: What is Parabolic SAR?
Parabolic SAR is a trend-following indicator that plots dots above or below price. SAR stands for Stop and Reverse.
Q: What do Parabolic SAR dots below price mean?
Dots below price usually mean the indicator is tracking an uptrend state.
Q: What do Parabolic SAR dots above price mean?
Dots above price usually mean the indicator is tracking a downtrend state.
Q: Is a Parabolic SAR flip a buy or sell signal?
Not by itself. A flip can warn that the trend state has changed, but it should be checked against price action, trend context and risk.
Q: What are the default Parabolic SAR settings?
Common defaults are an acceleration factor of 0.02 and a maximum acceleration factor of 0.20.
Q: What happens if I increase the acceleration factor?
The dots move closer to price more quickly. That can tighten stops, but it can also increase whipsaws.
Q: Does Parabolic SAR work in sideways markets?
It often struggles in sideways markets because price can cross the dots repeatedly without starting a real trend.
Q: Can I code Parabolic SAR in Python?
Yes. The Python tutorial above calculates Parabolic SAR and plots the dots on a candlestick chart.
Final Thoughts on Parabolic SAR
Parabolic SAR is useful because it gives traders a clear visual trailing-stop reference. The dots show which side of price the indicator is tracking, and the flip warns that the trend state may have changed.
The danger is treating the dots as automatic trade instructions. In a clean trend, Parabolic SAR can help you stay with the move. In a sideways market, it can flip repeatedly and become a source of weak signals.
The best way to use it is to give it a specific job. Use it to trail a stop. Use it to mark possible trend-state changes. Use it with ADX or moving averages when you want trend confirmation. Use ATR or price structure when you need more realistic risk placement.
The dots are helpful, but they are not the trade. The trade still needs context, risk control and a reason for being there.


