Updated May 2026: I’ve refreshed this Williams %R guide with a clearer formula explanation, more detailed notes on -20 and -80 readings, and an updated Python chart tutorial for readers who want to build the indicator step by step.
What Is the Williams %R Indicator?
Williams %R is a momentum oscillator that shows where the latest close sits inside a recent high-low range.
If price closes near the top of that range, Williams %R sits close to 0. If price closes near the bottom of the range, Williams %R moves toward -100.
That upside-down scale is the first thing that catches people out. A reading near 0 is high on the indicator. A reading near -100 is low. On many charting platforms, traders watch the -20 and -80 zones as rough reference areas.
Williams %R is often used to look for stretched conditions, turns, and divergence. I would not treat those readings as automatic buy or sell signals. In a strong trend, the indicator can stay near one end of its range for longer than a new trader expects.
In this guide I’ll walk through where Williams %R came from, how the formula works, how traders read the usual signals, and how to build the indicator in Python step by step.
Where Williams %R Comes From
Williams %R is associated with Larry Williams, the trader and author whose work also appears in other technical-analysis indicators and trading systems.
The indicator was designed to measure the close against the recent high-low range. That puts it in the same broad family as Stochastics, although the scale is inverted and shown from 0 down to -100.
The original attraction is easy to understand. Traders wanted a quick way to see whether price was closing near the top or bottom of its recent range. A close near the top suggests strong upside pressure over that lookback window. A close near the bottom suggests downside pressure.
The danger is also easy to understand. A market closing near the top of its range is not always “too high.” Sometimes it is simply trending well. A market closing near the bottom is not always “too low.” Sometimes sellers are still in control.
That is why I read Williams %R as a range-position and momentum tool first, not as a standalone reversal system.
How Williams %R Is Calculated
Williams %R measures where the latest close sits inside the recent high-low range. The common default lookback is 14 periods, but the same formula works on any chart interval.
Before the formula, here are the symbols:
H means the highest high in the lookback period.
L means the lowest low in the lookback period.
C means the latest close.
n means the lookback period.
Williams\ \%R = -100 \times \frac{H_n - C}{H_n - L_n}Williams %R = -100 × (lookback high – close) / (lookback high – lookback low)
Suppose the highest high over the lookback period is 100, the lowest low is 90, and the latest close is 98.
Williams\ \%R = -100 \times \frac{100 - 98}{100 - 90} = -20Williams %R = -20
That tells us the close is near the top of the recent range.
Now suppose the close is 92 instead.
Williams\ \%R = -100 \times \frac{100 - 92}{100 - 90} = -80Williams %R = -80
That tells us the close is near the bottom of the recent range.
This is why traders often watch -20 and -80. They simply mark areas where the close is near one end of the recent range.
What Williams %R Is Good At
Williams %R is useful because it gives a quick range-position reading.
It shows whether price is closing near the top, middle, or bottom of its recent high-low range. That can help traders see whether buyers are keeping the market near the upper end of the range, or whether sellers are keeping it near the lower end.
A reading above -20 usually means price is closing near the top of the lookback range. A reading below -80 usually means price is closing near the bottom.
Those zones are often called overbought and oversold, but the labels can be misleading. A market near the top of its range is not automatically too high. A market near the bottom is not automatically too low.
In a strong uptrend, Williams %R can stay near 0 for longer than feels reasonable. In a strong downtrend, it can stay near -100 while price keeps falling.
I would use Williams %R as a context tool first. It can show where the latest close sits inside the recent range. The chart still has to tell you whether that reading is exhaustion, trend strength, or just noise.
How Traders Read Williams %R Signals
The -20 zone
When Williams %R is above -20, the latest close is near the top of the recent range.
Some traders call this overbought. I prefer to think of it as “closing near the highs.” That wording is less dangerous.
A reading above -20 can mean price is stretched. It can also mean buyers are in control and price keeps closing near the high of the range.
I would not short a market just because Williams %R moves above -20. I would want extra evidence, such as a failed breakout, bearish divergence, a reversal candle, or a broader market reason to expect the move to stall.
The -80 zone
When Williams %R is below -80, the latest close is near the bottom of the recent range.
Some traders call this oversold. Again, the safer reading is “closing near the lows.”
A reading below -80 can mean price is stretched to the downside. It can also mean sellers are still pressing the market lower.
I would not treat a move below -80 as a buy signal by itself. In a strong downtrend, that can be exactly where new traders try to catch a falling knife.
Some Williams-style interpretations use more extreme levels than the common -20 and -80 zones. You may see references to readings near -95 or -10, especially when traders are trying to separate strong bull-market pullbacks from bear-market rallies.
The useful lesson is not that one pair of thresholds is perfect. The useful lesson is that market regime matters. A level that makes sense in a strong bull market may be dangerous in a falling market.
Divergence
Divergence appears when price and Williams %R stop confirming each other.
A bullish divergence forms when price makes a lower low but Williams %R makes a higher low. That can suggest downside pressure is weakening.
A bearish divergence forms when price makes a higher high but Williams %R makes a lower high. That can suggest upside pressure is weakening.
Divergence is useful, but it is easy to see after the turn and harder to trade in real time. I would treat it as an early warning sign, not a complete trade plan.
| Williams %R reading | What it shows | How I would read it |
|---|---|---|
| Above -20 | Close is near the top of the recent range | Strength or a stretched move |
| Below -80 | Close is near the bottom of the recent range | Weakness or a stretched move |
| Stays above -20 | Price keeps closing near the range high | Possible strong uptrend |
| Stays below -80 | Price keeps closing near the range low | Possible strong downtrend |
| Bullish divergence | Price makes a lower low while %R makes a higher low | Downside pressure may be fading |
| Bearish divergence | Price makes a higher high while %R makes a lower high | Upside pressure may be fading |
Williams %R Pros and Cons
Williams %R is useful because it is quick to read. Once you understand the 0 to -100 scale, the indicator gives a clear view of whether price is closing near the top or bottom of its recent range.
The weakness is that the same clear reading can be too tempting. A move above -20 can look like an obvious sell. A move below -80 can look like an obvious buy. In a strong trend, that can be exactly the wrong reaction.
I would use Williams %R when I want a fast range-position check. I would be more careful using it as a standalone entry tool.
| Strength | Why it helps |
|---|---|
| Clear scale | The 0 to -100 range is easy to read once understood |
| Shows range position | It shows whether price is closing near the recent high or low |
| Useful for divergence | It can show when price makes a new extreme but momentum does not confirm |
| Responsive | It reacts quickly to changes in the close relative to the range |
| Works across time frames | The same logic can be used on intraday, daily or weekly charts |
| Weakness | Why it matters |
|---|---|
| Reversed scale | New traders can misread readings near 0 and -100 |
| False reversal signals | Overbought or oversold readings can persist in trends |
| Sensitive to lookback period | Shorter settings can become noisy |
| Weak in strong trends if used counter-trend | The indicator can stay stretched while price keeps moving |
| Needs context | Range-position alone does not define the full trade |
Choosing Williams %R Period Settings
A common Williams %R setting is 14 periods. That means the indicator compares the latest close with the highest high and lowest low over the last 14 bars.
The word period means bars, not necessarily days. On a daily chart, 14 periods means 14 daily candles. On a 15-minute chart, it means 14 candles of 15 minutes each.
A shorter lookback makes Williams %R more sensitive. The line reacts faster when price moves toward the top or bottom of the range, but it can also become noisier.
A longer lookback makes the indicator slower. It can smooth out some of the twitchier readings, but it may also react late when the market turns.
Larry Williams’ own comments are often read as a warning not to treat one setting as perfect. The market, the time frame and the trading regime matter. A setting that looks useful in a range may behave badly in a strong trend.
When testing Williams %R, I would change one thing at a time. Start with 14. Then try a shorter lookback and a longer lookback on the same chart. The point is to see how the indicator changes, not to hunt for a setting that happened to fit one old move perfectly.
| Setting change | What usually happens | Main warning |
|---|---|---|
| Shorter lookback | Faster Williams %R turns | More noise and false flips |
| Longer lookback | Smoother readings | Slower reaction |
| Common -20 / -80 zones | Easy range-position reference | Not automatic buy/sell levels |
| More extreme zones such as -10 / -95 | Fewer signals | May arrive too late or miss moves |
Coding Williams %R in Python and Plotting the Chart
Now we can build Williams %R in Python.
I am going to keep this as a step-by-step tutorial rather than dropping in one large script. Each Python-labelled block goes into the same file, in order. By the end, we will have downloaded market data, calculated Williams %R, added the -20 and -80 reference lines, and plotted the indicator under a candlestick chart.
For this example I use SPY. You can swap it for an index, stock, ETF, future proxy or forex pair later, as long as Yahoo Finance has the data.
This guide assumes you already have Python installed and are using Visual Studio Code.
Open a terminal in VS Code by clicking Terminal > New Terminal, then run:
python -m pip install yfinance pandas mplfinance matplotlibOn some Windows machines, this version works instead:
py -m pip install yfinance pandas mplfinance matplotlibStep 1: Create the file and import the libraries
Create a new Python file and save it as:
williams_r.py
At the top of the file, add:
import pandas as pd
import yfinance as yf
import mplfinance as mpf
from matplotlib.lines import Line2D
pandas stores the price data in a table and lets us calculate rolling highs and lows.
yfinance downloads the market data.
mplfinance draws the candlestick chart.
Line2D lets us create a clean legend for the Williams %R line and reference levels.
Step 2: Add the settings
Next, add a small settings section. Keeping these values near the top makes the script easier to change later.
ticker = "SPY"
chart_title = "SPDR S&P 500 ETF"

start_date = "2025-05-01"
end_date = "2026-05-01"

lookback_period = 14

overbought_level = -20
oversold_level = -80
ticker is the Yahoo Finance symbol.
chart_title is the title that will appear on the chart.
The dates use YYYY-MM-DD format. yfinance treats the end date as a cut-off, so you can push it one trading day later if you want to include the most recent available bar.
lookback_period controls how far back the script looks for the highest high and lowest low.
overbought_level and oversold_level draw the usual -20 and -80 reference lines.
Step 3: Define the Williams %R function
Now define the function that calculates Williams %R.
def calculate_williams_r(data, lookback=14):
    highest_high = data["High"].rolling(window=lookback).max()
    lowest_low = data["Low"].rolling(window=lookback).min()
    close = data["Close"]

    williams_r = -100 * (highest_high - close) / (highest_high - lowest_low)

return williams_rhighest_high finds the highest high over the lookback window.
lowest_low finds the lowest low over the same window.
close is the closing-price column.
The formula then compares the close with the recent high-low range and multiplies by -100. That is what creates the 0 to -100 scale.
Step 4: Download the market data
data = yf.download(
    ticker,
    start=start_date,
    end=end_date,
    auto_adjust=True,
    progress=False,
    multi_level_index=False
)

if data.empty:
    raise RuntimeError("No data was downloaded. Check the ticker symbol and date range.")

if isinstance(data.columns, pd.MultiIndex):
    data.columns = data.columns.get_level_values(0)

data.index = pd.DatetimeIndex(data.index)This downloads open, high, low, close and volume data.
auto_adjust=True keeps the price data adjusted where applicable.
progress=False removes the download progress bar.
multi_level_index=False keeps the columns easier to work with.
The final line makes sure the index is treated as dates, which mplfinance expects when plotting.
Step 5: Calculate Williams %R and add the reference lines
Now we calculate Williams %R and add the -20 and -80 reference lines.
data["Williams %R"] = calculate_williams_r(data, lookback=lookback_period)

data["-20 Line"] = overbought_level
data["-80 Line"] = oversold_levelThink of data as a spreadsheet. It already has columns such as Open, High, Low, Close and Volume. These lines add Williams %R, -20 Line and -80 Line as new columns.
We also remove the first blank Williams %R values before plotting. Those blanks appear because the rolling calculation needs enough bars before it can produce a value.
Step 6: Define the Williams %R chart lines
Next we tell mplfinance which indicator lines to draw under the price chart.
williams_plots = [
    mpf.make_addplot(
        plot_data["Williams %R"],
        panel=2,
        color="blue",
        width=1.2,
        ylabel="Williams %R"
    ),
    mpf.make_addplot(
        plot_data["-20 Line"],
        panel=2,
        color="red",
        linestyle="--",
        width=0.8
    ),
    mpf.make_addplot(
        plot_data["-80 Line"],
        panel=2,
        color="green",
        linestyle="--",
        width=0.8
    )
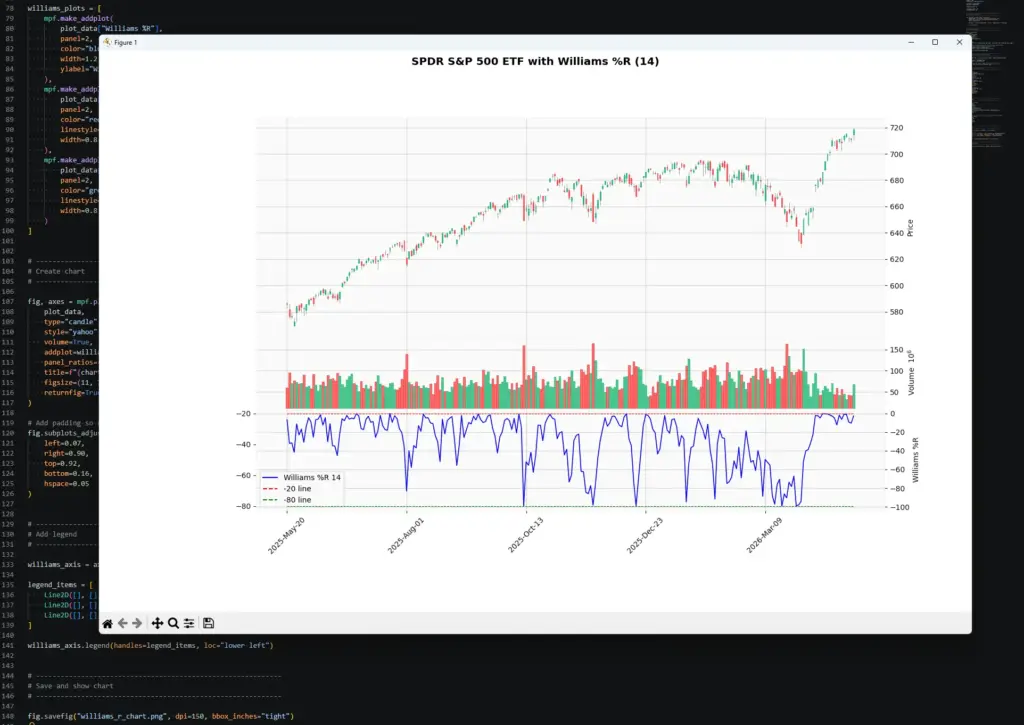
]The blue line is Williams %R.
The red dashed line marks -20.
The green dashed line marks -80.
panel=2 places these lines under the price and volume panels.
Step 7: Create the chart
Now create the candlestick chart.
fig, axes = mpf.plot(
    plot_data,
    type="candle",
    style="yahoo",
    volume=True,
    addplot=williams_plots,
    panel_ratios=(3, 1, 1.4),
    title=f"{chart_title} with Williams %R ({lookback_period})",
    figsize=(11, 7),
    returnfig=True
)

fig.subplots_adjust(
    left=0.07,
    right=0.90,
    top=0.92,
    bottom=0.16,
    hspace=0.05
)type="candle" gives us the candlestick chart.
volume=True adds the volume panel.
addplot=williams_plots adds Williams %R and the -20 and -80 lines.
panel_ratios controls the relative size of the price, volume and Williams %R panels.
subplots_adjust gives the chart extra breathing room so the right-hand labels and angled dates are not clipped.
Step 8: Add the legend and show the chart
Finally, add the legend and show the chart.
williams_axis = axes[4] if len(axes) > 4 else axes[-1]

legend_items = [
    Line2D([], [], color="blue", label=f"Williams %R {lookback_period}"),
    Line2D([], [], color="red", linestyle="--", label="-20 line"),
    Line2D([], [], color="green", linestyle="--", label="-80 line")
]

williams_axis.legend(handles=legend_items, loc="lower left")

fig.savefig("williams_r_chart.png", dpi=150, bbox_inches="tight")

mpf.show()mplfinance creates several axes behind the scenes. The williams_axis line grabs the lower Williams %R panel so the legend appears in the right place.
fig.savefig() saves the chart as a PNG image in the same folder as the script.
mpf.show() opens the chart window.
Step 9: Run the script
Save williams_r.py by pressing Ctrl+S.
The easiest route is usually to click the play button in the top-right corner of VS Code. If that works, the chart window should open.
You can also run it from the terminal. Open Terminal > New Terminal, move into the folder where you saved the script, then run:
python williams_r.pyOn some Windows setups, use:
py williams_r.pyYour chart should show SPY candlesticks at the top, volume underneath, and a Williams %R panel below that. The exact shape will depend on the ticker, date range and lookback period you choose.
Once the script works, start changing the inputs.
To change the market, edit:
ticker = "SPY"
chart_title = "SPDR S&P 500 ETF"To change the date range, edit:
start_date = "2025-05-01"
end_date = "2026-05-01"To change the Williams %R lookback, edit:
lookback_period = 14Try one change at a time. A shorter lookback should react faster but look noisier. A longer lookback should look smoother but react later.
You can also change the reference lines:
overbought_level = -20
oversold_level = -80The usual -20 and -80 levels are reference zones, not automatic trade rules. If you test more extreme levels such as -10 and -95, make sure you test them across more than one market and more than one date range.
Williams %R Trading Examples and Common Mistakes
The easiest way to misuse Williams %R is to treat every move above -20 or below -80 as a trade. The examples below are better thought of as chart-reading situations rather than mechanical systems.
Example 1: Strong uptrend
In a strong uptrend, Williams %R can stay near the top of its range for longer than expected.
A new trader may see Williams %R above -20 and assume the market is overbought and ready to fall. Sometimes that will be right. Often, in a strong trend, it simply means price keeps closing near the top of its recent range.
This is where the indicator is useful as a warning, but dangerous as a trigger. If price is above a rising moving average, breaking higher, and holding near the highs, a high Williams %R reading may be showing trend strength rather than exhaustion.
I would not short that setup just because %R is above -20. I would want a failed breakout, bearish divergence, a reversal candle, or some other reason to think the trend is losing force.
Example 2: Strong downtrend
The same problem appears in reverse during a strong downtrend.
Williams %R below -80 means price is closing near the lower end of its recent range. That may look oversold, but in a falling market sellers can keep control for several more bars.
Trying to buy every dip below -80 can become a falling-knife strategy. The better question is whether there is any sign that downside pressure is actually fading.
A bullish divergence, a failed breakdown, a reclaim of a moving average, or a strong reversal candle may make the setup more interesting. The -80 reading by itself is not enough.
Example 3: Range-bound market
Williams %R is often easier to read in a range-bound market.
If price is repeatedly moving between a clear support area and a clear resistance area, the indicator can help show when the close is near one side of that range.
A move below -80 near support may be worth watching for a bounce setup. A move above -20 near resistance may be worth watching for a stall or rejection.
The key phrase is “worth watching.” I would still want price to react. If price breaks cleanly through support or resistance, the old range-trading idea may no longer apply.
Example 4: Combining Williams %R with other tools
Williams %R works better when it has one job on the chart.
For example, you might use Williams %R to show whether price is closing near the top or bottom of its recent range, then use a moving average for trend context. In that setup, you might only take bullish Williams %R setups when price is above a rising moving average, or only take bearish setups when price is below a falling moving average.
You can also compare it with other momentum tools. RSI and Stochastics are useful comparisons because they also have bounded scales. MACD and TRIX are different because they are built from moving-average logic and are usually read around signal lines or zero lines.
The point is not to pile indicators onto the chart. The point is to avoid asking Williams %R to answer every question by itself.
The best line from Williams’ own notes is still the caution rather than the signal rule:
““Not all signals will be correct. I have constructed no perfect indices. The Holy Grail is yet to be found.“
He goes on to say his ultimate protection is the use of stops and that he takes guidance from other indicators in addition to this.
That is exactly how I would treat Williams %R. It can mark useful areas on a chart, but stops, risk control and market context still matter.
Frequently Asked Questions about the Williams %R
Q: What is Williams %R?
Williams %R is a momentum oscillator that shows where the latest close sits inside a recent high-low range. It is plotted from 0 down to -100.
Q: How is Williams %R calculated?
Williams %R = -100 × (lookback high – close) / (lookback high – lookback low).
Q: What does a Williams %R reading above -20 mean?
It means price is closing near the top of its recent range. Traders often call this overbought, but it can also show trend strength.
Q: What does a Williams %R reading below -80 mean?
It means price is closing near the bottom of its recent range. Traders often call this oversold, but it can also show strong downside pressure.
Q: Is Williams %R a buy or sell signal?
Not by itself. A move above -20 or below -80 is context, not a complete trade. Price action, trend, support and resistance, or another indicator should help confirm the setup.
Q: What is the usual Williams %R setting?
A common setting is 14 periods. Shorter settings react faster and can be noisier. Longer settings are smoother but slower.
Q: How is Williams %R different from Stochastics?
Both compare the close with a recent high-low range. Williams %R uses an inverted 0 to -100 scale, while Stochastics is usually shown from 0 to 100.
Q: Can I code Williams %R in Python?
Yes. The Python section above calculates Williams %R from high, low and close data, then plots it below a candlestick chart.
Williams %R Key Takeaways
- Williams %R shows where the latest close sits inside a recent high-low range.
- The indicator is plotted from 0 to -100, which makes the scale feel upside down at first.
- Readings above -20 usually mean price is closing near the top of the lookback range.
- Readings below -80 usually mean price is closing near the bottom of the lookback range.
- Those zones are not automatic buy or sell signals. In strong trends, Williams %R can stay near one end of its range for longer than expected.
- Divergence between price and Williams %R can warn that momentum is fading, but it still needs price confirmation.
- A common lookback setting is 14 periods, but the best setting depends on the market and time frame being tested.
- Williams %R is often more useful when combined with trend context, support and resistance, moving averages, volume, or another momentum indicator.
- The Python tutorial above shows how to calculate and plot Williams %R so you can test the indicator yourself.
The main lesson is not to memorise one perfect Williams %R threshold. The useful part is learning what the indicator is actually showing. It tells you whether price is closing near the top or bottom of its recent range. The trade still needs context.