
Updated May 2026: I’ve refreshed this Klinger Volume Oscillator guide with a clearer volume-force explanation, more specific notes on signal-line crosses and divergence, and an updated Python chart tutorial.

What Is the Klinger Volume Oscillator?
The Klinger Volume Oscillator, usually shortened to KVO, is a volume-based momentum indicator.
It tries to measure whether volume is supporting the direction of price. Instead of looking at raw volume bars, KVO builds a volume-force series and then compares a faster moving average of that force with a slower moving average.
The common version uses a 34-period EMA (exponential moving average) and a 55-period EMA of volume force. A 13-period EMA of the KVO is often added as the signal line.
That gives traders three things to watch: the KVO line, the signal line, and divergence between price and the oscillator.
I would not treat every KVO cross as a trade by itself. It is a volume-confirmation tool, not a complete trading system. The outcome being sought is whether volume appears to support the price move, disagree with it, or warn that the trend is losing force.
Where the Klinger Volume Oscillator Comes From
The Klinger Volume Oscillator was developed by Stephen Klinger.
Klinger wanted an indicator that used both price and volume to track money flow through a market. The idea was to keep some sensitivity to shorter-term volume changes while still trying to capture the larger trend in volume force.
That is why the KVO uses two moving averages of volume force. The faster average reacts to more recent changes, while the slower average gives a broader reference. The oscillator is the difference between the two.
The result is similar in spirit to MACD, but the input is different. MACD compares moving averages of price. KVO compares moving averages of volume force.
How the Klinger Volume Oscillator Is Calculated
KVO is more involved than OBV because it does not simply add or subtract the whole bar’s volume. It first creates a volume-force value, then smooths that force with two exponential moving averages.
Some platform descriptions use a simplified version where volume is treated as positive when the key price rises and negative when it falls. The fuller Klinger-style calculation also adjusts for the bar’s high-low range and the current trend state.
The core workflow is:
- Work out the trend direction.
- Calculate volume force.
- Smooth volume force with a short EMA and a long EMA.
- Subtract the long EMA from the short EMA.
- Add a signal line.
Before the formulas, here are the symbols:
H means high.
L means low.
C means close.
V means volume.
T means trend direction.
Range sometimes called the daily measurement dm in older descriptions, is better thought of as the current bar’s range. It is the high minus the low for whatever chart period you are using.
cm means cumulative measurement, a running range measure used in the volume-force calculation.
VF means volume force.
Trend direction
T =
\begin{cases}
+1, & \text{if } H_t + L_t + C_t > H_{t-1} + L_{t-1} + C_{t-1} \\
-1, & \text{otherwise}
\end{cases}
Trend is positive when today’s high + low + close is greater than yesterday’s high + low + close. Otherwise it is negative.
Current bar range measurement
Range_t = H_t - L_t
Current bar range = current high – current low
Volume force
VF_t = V_t \times T_t \times 100 \times 2\left(\frac{Range_t}{CM_t} - 1\right)Volume force = volume × trend direction × range adjustment
The formula looks intimidating, but the idea is simpler than it appears. KVO is trying to decide whether volume is flowing with the current trend and how forceful that move is relative to the recent range.
KVO line
KVO_t = EMA_{34}(VF_t) - EMA_{55}(VF_t)KVO = 34-period EMA of volume force – 55-period EMA of volume force
Signal line
Signal_t = EMA_{13}(KVO_t)KVO signal line = 13-period EMA of the KVO line
| Component | What it does | Trader translation |
|---|---|---|
| Trend direction | Checks whether price pressure is up or down | Gives volume a direction |
| Volume force | Combines volume with trend and range | Measures volume pressure |
| 34 EMA of VF | Faster volume-force average | Recent volume pressure |
| 55 EMA of VF | Slower volume-force average | Broader volume pressure |
| KVO | Fast VF EMA minus slow VF EMA | Volume-force oscillator |
| Signal line | 13 EMA of KVO | Smoother trigger line |
What the Klinger Volume Oscillator Is Good At
The Klinger Volume Oscillator is designed to compare shorter-term and longer-term volume force.
That makes it a volume-momentum tool. It is not just asking whether price went up or down. It is trying to judge whether volume is supporting the direction of the move.
The KVO line is the main oscillator. The signal line, sometimes called the Klinger Oscillator Signal line or KOS, is usually a 13-period EMA of the KVO line.
Traders usually watch three things:
The direction of the KVO line.
Crosses between KVO and the signal line.
Divergence between price and KVO.
When KVO rises, it can suggest volume force is improving. When KVO falls, it can suggest volume force is weakening. That still needs price context. A rising KVO in a messy range is not the same as a rising KVO during a clean breakout.
I would use KVO as a volume-confirmation tool first. It can help show whether volume force is lining up with the price move, but it should not be treated as a standalone trading system.
KVO trend confirmation
KVO can also be used as a trend-confirmation tool.
If price is rising and KVO is rising too, volume force is broadly supporting the move. If price is rising but KVO is falling, the price move may be losing participation.
If price is falling and KVO is falling too, volume force is supporting the decline. If price is falling but KVO starts to rise, the selling pressure may be fading.
This is where KVO can be more useful than raw volume bars. It tries to turn volume behaviour into a smoother directional reading.
KVO signal-line crosses
A signal-line cross happens when the KVO line crosses its signal line.
When KVO crosses above the signal line, volume force is improving relative to its own recent average. Traders often read that as bullish confirmation.
When KVO crosses below the signal line, volume force is weakening relative to its own recent average. Traders often read that as bearish confirmation.
I would not treat either cross as an automatic entry. Like MACD, KVO can cross back and forth in sideways markets. The cross is more useful when it agrees with price structure, trend direction, or a breakout.
KVO divergence
Divergence appears when price and KVO stop confirming each other.
A bullish divergence forms when price makes a lower low but KVO makes a higher low. That can suggest downside pressure is losing force.
A bearish divergence forms when price makes a higher high but KVO makes a lower high. That can suggest upside pressure is weakening.
Divergence is useful as a warning sign, but it is easy to see after the turn and harder to trade in real time. I would still wait for price to confirm the change.
| KVO reading | What it shows | How I would read it |
|---|---|---|
| Price makes lower low, KVO makes higher low | Downside volume force may be fading | Bullish divergence warning |
| Price makes higher high, KVO makes lower high | Upside volume force may be fading | Bearish divergence warning |
| KVO crosses above signal line | Volume force improves versus its recent average | Possible bullish confirmation |
| KVO crosses below signal line | Volume force weakens versus its recent average | Possible bearish confirmation |
| Price rising, KVO rising | Volume force supports the move | Trend confirmation |
| Price rising, KVO falling | Price and volume force disagree | Possible warning |
Choosing Klinger Volume Oscillator Parameters
The common KVO settings are 34, 55 and 13.
The 34-period EMA is the faster volume-force average.
The 55-period EMA is the slower volume-force average.
The 13-period EMA is the signal line.
Shorter settings make KVO react faster. That can help on short-term charts, but it can also create more false crosses.
Longer settings make the oscillator smoother. That can reduce noise, but it can also make the signal later.
I would start with the common 34, 55, 13 setup, then test changes one at a time. If you shorten everything at once, it becomes hard to know whether you improved the chart or simply made the indicator more twitchy.
| Setting change | What usually happens | Main warning |
|---|---|---|
| Shorter KVO EMAs | Faster reaction to volume-force changes | More noise |
| Longer KVO EMAs | Smoother oscillator | Later confirmation |
| Shorter signal line | Earlier KVO crosses | More false crosses |
| Longer signal line | Cleaner-looking crosses | Slower turns |
| Default 34, 55, 13 | Common starting point | Not optimal for every market |
Klinger Volume Oscillator Pros and Cons
The main strength of the Klinger Volume Oscillator is that it combines price direction and volume into one volume-force reading.
That makes it more informative than raw volume bars. A volume spike by itself tells you activity increased. KVO tries to show whether that activity is supporting or weakening the price move.
The weakness is complexity. KVO has more moving parts than OBV or simple volume analysis. It uses trend direction, range measurement, cumulative measurement, volume force, two EMAs and a signal line. That gives it more nuance, but also more room for confusion.
I would use KVO when I want a smoother volume-confirmation tool. I would be more careful using it as a standalone entry signal.
| Strength | Why it helps |
|---|---|
| Combines price and volume | Gives volume a directional context |
| Uses volume force | Attempts to measure pressure behind the move |
| Signal line included | Makes KVO crosses easier to read |
| Useful for divergence | Can warn when price and volume force stop confirming |
| Smoother than raw volume | Filters some day-to-day volume noise |
| Weakness | Why it matters |
|---|---|
| Complex formula | Harder for beginners to understand |
| Can whipsaw | Signal-line crosses can fail in sideways markets |
| Sensitive to settings | Different EMA lengths can change the signals |
| Volume quality matters | Spot FX and CFD volume may be less reliable than exchange volume |
| Needs price context | KVO alone does not define entry, stop or target |
KVO vs OBV, RSI and Stochastics
KVO is often grouped with volume indicators, but it behaves differently from simpler tools such as OBV.
OBV adds volume on up closes and subtracts volume on down closes. It is simple and easy to read. KVO is more complex because it creates a volume-force series and then smooths that force with moving averages.
RSI and Stochastics are different again. They are bounded momentum oscillators. RSI looks at recent gains and losses. Stochastics looks at where price closes inside its recent high-low range. KVO is not bounded in the same way, and it is built around volume force rather than only price behaviour.
That means KVO is most useful when the trader wants to ask a volume question: is volume force confirming the move, disagreeing with it, or warning that momentum is fading?
| Indicator | Main input | Bounded? | Main use |
|---|---|---|---|
| KVO | Volume force from price and volume | No | Volume confirmation and divergence |
| OBV | Close direction plus volume | No | Simple cumulative volume flow |
| RSI | Recent gains and losses | Yes | Momentum and stretched conditions |
| Stochastics | Close position inside high-low range | Yes | Range-position and turns |
| MACD | Fast EMA minus slow EMA | No | Moving-average momentum |
Quick KVO Takeaways Before We Code
- KVO stands for Klinger Volume Oscillator.
- It combines price and volume into a volume-force reading.
- The common settings are 34, 55 and 13.
- The KVO line is usually the 34-period EMA of volume force minus the 55-period EMA of volume force.
- The signal line is usually a 13-period EMA of the KVO line.
- A KVO cross above the signal line can support a bullish reading.
- A KVO cross below the signal line can support a bearish reading.
- KVO divergence can warn that price and volume force are no longer confirming each other.
- KVO is more complex than OBV, so the formula needs more care.
- Volume quality matters, especially outside exchange-traded markets.
- The Python tutorial below calculates KVO and plots it under a candlestick chart.
Now we can build the Klinger Volume Oscillator ourselves. The code section follows the same idea as the formula: calculate volume force, smooth it with a fast and slow EMA, add the signal line, and plot the result under price.
Coding the Klinger Volume Oscillator in Python
Now we can build the Klinger Volume Oscillator in Python.
I am going to keep this as a step-by-step tutorial rather than dropping in one large script. Each Python-labelled block goes into the same file, in order. By the end, we will have downloaded market data, calculated KVO and its signal line, and plotted them under a candlestick chart.
For this example I use Apple stock. You can change the ticker later once the script is working.
Step 1: Install the Python libraries
This guide assumes you already have Python installed and are using Visual Studio Code.
Open a terminal in VS Code by clicking Terminal > New Terminal, then run:
python -m pip install pandas yfinance mplfinance matplotlib numpyOn some Windows machines, this version works instead:
py -m pip install pandas yfinance mplfinance matplotlib numpyStep 2: Create the file and import the libraries
Create a new Python file and save it as:
klinger.py
At the top of the file, add:
import pandas as pd
import yfinance as yf
import mplfinance as mpf
import numpy as np
from matplotlib.lines import Line2Dpandas stores the market data in a table.
yfinance downloads the price data.
mplfinance draws the candlestick chart.
numpy helps with the volume-force calculation.
Line2D lets us create a clean legend for the KVO and signal line.
Step 3: Add the settings
Next, add the settings near the top of the file. Keeping these values together makes the script easier to change later.
ticker = "AAPL"
chart_title = "Apple"

start_date = "2025-05-01"
end_date = "2026-05-01"

short_period = 34
long_period = 55
signal_period = 13
ticker is the Yahoo Finance symbol.
chart_title is the title printed on the chart.
The dates use YYYY-MM-DD format. yfinance treats the end date as a cut-off, so you can push it one trading day later if you want the most recent available bar included.
short_period is the faster EMA of volume force.
long_period is the slower EMA of volume force.
signal_period is the EMA applied to the KVO line.
Step 4: Download the market data
Now download the market data.
data = yf.download(
    ticker,
    start=start_date,
    end=end_date,
    auto_adjust=True,
    progress=False,
    multi_level_index=False
)

if data.empty:
    raise RuntimeError("No data was downloaded. Check the ticker symbol and date range.")

if isinstance(data.columns, pd.MultiIndex):
    data.columns = data.columns.get_level_values(0)

data.index = pd.DatetimeIndex(data.index)
This downloads open, high, low, close and volume data.
auto_adjust=True keeps the price series adjusted where applicable.
progress=False removes the download progress bar.
multi_level_index=False keeps the columns easier to work with.
The final line makes sure the index is treated as dates, which mplfinance expects when plotting.
Step 5: Define the KVO function
Now define the function that calculates the Klinger Volume Oscillator and its signal line.
This follows the fuller volume-force structure discussed earlier: trend direction, current bar range, cumulative measurement, volume force, then the fast and slow EMAs.
def calculate_kvo(data, short_period=34, long_period=55, signal_period=13):
    high = data["High"]
    low = data["Low"]
    close = data["Close"]
    volume = data["Volume"]

    hlc = high + low + close

    trend = pd.Series(np.where(hlc > hlc.shift(1), 1, -1), index=data.index)
    trend.iloc[0] = 1

    current_range = high - low
    cm = pd.Series(index=data.index, dtype="float64")

    cm.iloc[0] = current_range.iloc[0]

    for i in range(1, len(data)):
        if trend.iloc[i] == trend.iloc[i - 1]:
            cm.iloc[i] = cm.iloc[i - 1] + current_range.iloc[i]
        else:
            cm.iloc[i] = current_range.iloc[i - 1] + current_range.iloc[i]

    # Avoid division by zero in unusually flat bars
    cm = cm.replace(0, np.nan)

    volume_force = volume * trend * 100 * 2 * ((current_range / cm) - 1)

    kvo = (
        volume_force.ewm(span=short_period, adjust=False).mean()
        - volume_force.ewm(span=long_period, adjust=False).mean()
    )

    kvo_signal = kvo.ewm(span=signal_period, adjust=False).mean()

return kvo, kvo_signal, volume_forcetrend turns positive or negative depending on whether today’s high + low + close is above or below the previous bar’s value.
current_range is the current high minus the current low.
cm is the cumulative measurement used in the volume-force calculation.
volume_force combines volume, trend direction and the range adjustment.
kvo is the fast EMA of volume force minus the slow EMA of volume force.
kvo_signal is a 13-period EMA of KVO.
Step 6: Calculate KVO and the signal line
Now call the function and add the results to the data table.
data["KVO"], data["KVO Signal"], data["Volume Force"] = calculate_kvo(
    data,
    short_period=short_period,
    long_period=long_period,
    signal_period=signal_period
)

plot_data = data.dropna(subset=["KVO", "KVO Signal"])Think of data as a spreadsheet. It already has Open, High, Low, Close and Volume columns. This step adds KVO, KVO Signal and Volume Force.
dropna() removes early blank rows before plotting.
Step 7: Define the chart lines
Next we tell mplfinance how to draw KVO and its signal line below the price chart.
kvo_plots = [
    mpf.make_addplot(
        plot_data["KVO"],
        panel=2,
        color="blue",
        width=1.2,
        ylabel="KVO"
    ),
    mpf.make_addplot(
        plot_data["KVO Signal"],
        panel=2,
        color="red",
        width=1.0
    )
]The blue line is KVO.
The red line is the signal line.
panel=2 places the KVO panel below price and volume.
Step 8: Create the chart
The mplfinance library’s plot function is used to create a candlestick chart of the stock data, with the KVO and signal line subplots added below the main chart. The returnfig=True argument is used to return the figure and axes objects, which are needed to add the legend in the next step.
fig, axes = mpf.plot(
    plot_data,
    type="candle",
    style="yahoo",
    volume=True,
    addplot=kvo_plots,
    panel_ratios=(3, 1, 1.4),
    title=f"{chart_title} with Klinger Volume Oscillator ({short_period}, {long_period}, {signal_period})",
    figsize=(11, 7),
    returnfig=True
)

fig.subplots_adjust(
    left=0.07,
    right=0.90,
    top=0.92,
    bottom=0.16,
    hspace=0.05
)
type="candle" gives us the candlestick chart.
volume=True adds the volume panel.
addplot=kvo_plots adds the KVO and signal line.
panel_ratios controls the relative size of the price, volume and KVO panels.
subplots_adjust gives the chart extra room so the right-hand labels and angled dates are not clipped.
Step 9: Add the legend and show the chart
Finally, add a legend, save the image and show the chart.
kvo_axis = axes[4] if len(axes) > 4 else axes[-1]

legend_items = [
    Line2D([], [], color="blue", label="KVO"),
    Line2D([], [], color="red", label="KVO Signal")
]

kvo_axis.legend(handles=legend_items, loc="upper left")

fig.savefig("klinger_volume_oscillator_chart.png", dpi=150, bbox_inches="tight")

mpf.show()fig.savefig() saves the chart as a PNG image in the same folder as the script.
mpf.show() opens the chart window.
Step 10: Run the script
Save klinger.py by pressing Ctrl+S.
The easiest route is usually to click the play button in the top-right corner of VS Code. If that works, the chart window should open.
You can also run it from the terminal. Open Terminal > New Terminal, move into the folder where you saved the script, then run:
python klinger.pyOn some Windows setups, use:
py klinger.pyYour chart should show Apple candlesticks at the top, volume underneath, and a KVO panel with the KVO line and signal line below it similar to mine shown below:
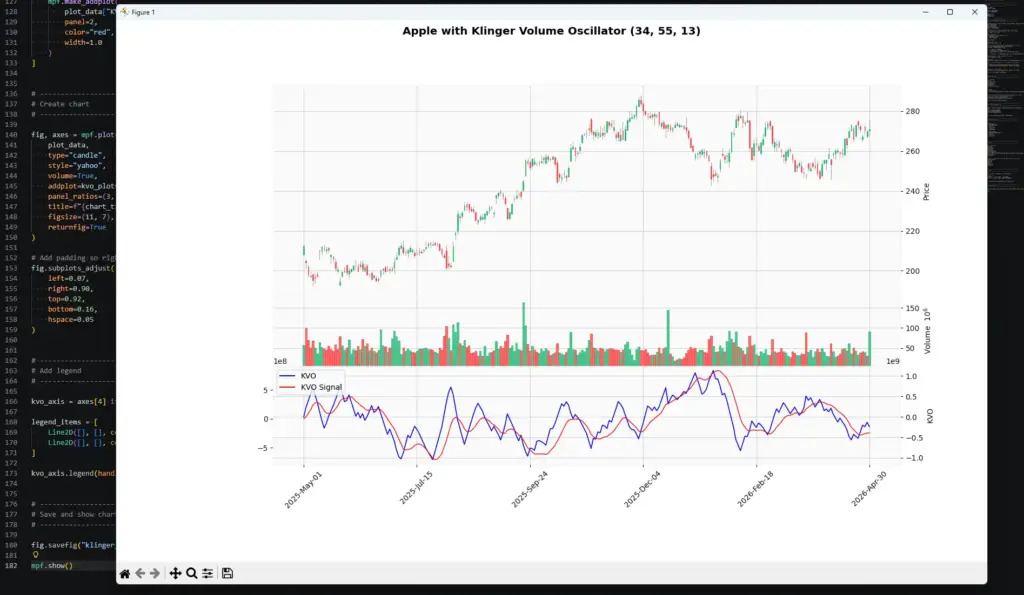
In this Apple example, the largest KVO surge appears around the sharp decline from the chart high. That suggests the strongest volume-force move on this chart was tied to the sell-off, not the later recovery. After the selling pressure fades, the oscillator falls quickly from its high reading, showing how fast the short-term volume-force picture can change.
This is why I would read KVO as a confirmation tool rather than a direction signal on its own. A large KVO move tells us volume force has become important, but the price chart still tells us whether that force is helping a trend, ending a move, or reversing.
KVO calculations can differ slightly between platforms because some use a simplified signed-volume version while others use the fuller volume-force calculation. The Python version above follows the fuller structure explained in this guide, so do not worry if it is not pixel-perfect against every commercial charting package.
Frequently Asked Questions
Q: What is the Klinger Volume Oscillator?
The Klinger Volume Oscillator, or KVO, is a volume-based oscillator that compares faster and slower moving averages of volume force.
Q: What are the common KVO settings?
Common settings are 34, 55 and 13. The 34-period EMA is the faster volume-force average, the 55-period EMA is the slower volume-force average, and the 13-period EMA is the signal line.
Q: What does a bullish KVO signal mean?
A bullish KVO reading usually means the KVO line has crossed above its signal line or that volume force is improving. It still needs price confirmation.
Q: What does a bearish KVO signal mean?
A bearish KVO reading usually means the KVO line has crossed below its signal line or that volume force is weakening.
Q: Is KVO better than OBV?
Not necessarily. OBV is simpler and easier to read. KVO is more complex and tries to capture volume force with more smoothing. The better choice depends on what you are testing.
Q: Can KVO be used in forex or CFDs?
It can be tested, but volume quality matters. Exchange-traded markets usually have cleaner volume data than decentralised spot FX or many CFD feeds.
Q: Can I code KVO in Python?
Yes. The Python tutorial above calculates volume force, KVO and the signal line, then plots them below a candlestick chart.
The Klinger Volume Oscillator is useful when you want volume confirmation with more structure than raw volume bars or OBV. I would still treat it as a context tool rather than a complete trading system. Signal-line crosses and divergences are starting points for analysis, not automatic trade entries.


