
Updated May 2026: I’ve refreshed this guide with clearer McClellan Oscillator formulas, better notes on breadth signals, divergence, Summation Index context, and a cleaner Python walkthrough.

What Is the McClellan Oscillator?
The McClellan Oscillator is a market breadth indicator.
Instead of looking only at the price of an index, it looks at how many stocks are advancing and how many are declining inside a market. That makes it useful for judging whether a rally or selloff is broad-based, or whether the index is being carried by a narrower group of stocks.
The basic idea is that if more stocks are advancing than declining, breadth is positive. If more stocks are declining than advancing, breadth is negative. The McClellan Oscillator smooths that breadth data with two exponential moving averages and then compares them.
A positive oscillator reading usually means shorter-term breadth is stronger than longer-term breadth. A negative reading usually means shorter-term breadth is weaker.
That does not make every zero-line cross a trade. Breadth can improve while price is still under resistance, and breadth can weaken while an index is still rising. I would treat the McClellan Oscillator as a market-health tool, not as a standalone buy or sell button.
McClellan Oscillator at a Glance
The McClellan Oscillator has four basic inputs.
Advances are the number of stocks that closed higher.
Declines are the number of stocks that closed lower.
Net advances are advances minus declines.
The oscillator compares a faster EMA of breadth with a slower EMA of breadth.
The common settings are 19 periods and 39 periods. If the faster breadth average is above the slower breadth average, the oscillator is positive. If the faster average is below the slower one, the oscillator is negative.
I would read it as a breadth momentum tool. It shows whether participation is improving or deteriorating beneath the surface of the index.
Where the McClellan Oscillator Came From
The McClellan Oscillator was developed by Sherman and Marian McClellan in 1969.
The indicator was built to look beyond index price. A headline index can rise even when participation is narrowing. It can also fall while internal breadth starts to improve beneath the surface. The McClellan Oscillator was designed to track that participation through advancing and declining issues.
That is why it still has a place on breadth charts. It is not trying to tell you whether one stock is overbought or oversold. It is trying to show whether the broader market is gaining or losing internal support.
This also explains why the data matters. You need advancing and declining issue data for the market you are studying. A McClellan Oscillator based on NYSE breadth is not the same thing as one based on Nasdaq breadth, S&P 500 breadth or sector breadth.
McClellan Oscillator Formula
The McClellan Oscillator is built from market breadth data.
The usual input is advancing issues and declining issues. Advancing issues are stocks that closed higher. Declining issues are stocks that closed lower.
The oscillator then smooths that breadth input with two exponential moving averages. The faster EMA uses 19 periods. The slower EMA uses 39 periods. The McClellan Oscillator is the difference between those two EMAs.
Formula key table
| Symbol | Meaning |
|---|---|
t | current period |
Aₜ | number of advancing issues |
Dₜ | number of declining issues |
NAₜ | net advances |
RANAₜ | ratio-adjusted net advances |
EMA₁₉ | 19-period exponential moving average |
EMA₃₉ | 39-period exponential moving average |
MOₜ | McClellan Oscillator value |
1. Calculate net advances
The simplest breadth input is net advances. This is advances minus declines.
NA_t = A_t - D_t
Net advances equal the number of advancing stocks minus the number of declining stocks.
2. Calculate ratio-adjusted net advances
Many modern charting platforms use a ratio-adjusted version. This divides net advances by the total number of advancing and declining issues.
RANA_t = \frac{A_t - D_t}{A_t + D_t}Ratio-adjusted net advances equal advances minus declines, divided by advances plus declines.
The ratio-adjusted version helps normalise breadth across periods where the number of listed or traded issues changes. Some platforms multiply the ratio by 1,000 or use a different display scale. The shape of the oscillator is usually more important than the raw number printed on the axis.
3. Calculate the 19-period and 39-period EMAs
The McClellan Oscillator uses a faster EMA and a slower EMA of the breadth input.
EMA_{19,t} = EMA_{19,t-1} + \alpha_{19}\left(RANA_t - EMA_{19,t-1}\right)EMA_{39,t} = EMA_{39,t-1} + \alpha_{39}\left(RANA_t - EMA_{39,t-1}\right)The 19-period EMA reacts faster to changes in breadth. The 39-period EMA reacts more slowly.
For the common McClellan settings, the smoothing constants are often written as 0.10 for the 19-period EMA and 0.05 for the 39-period EMA.
\alpha_{19} = \frac{2}{19 + 1} = 0.10\alpha_{39} = \frac{2}{39 + 1} = 0.054. Calculate the McClellan Oscillator
The oscillator is the faster breadth EMA minus the slower breadth EMA.
MO_t = EMA_{19,t} - EMA_{39,t}The McClellan Oscillator equals the 19-period EMA of breadth minus the 39-period EMA of breadth.
Unadjusted vs ratio-adjusted versions
You may see different McClellan Oscillator values on different platforms because not every platform scales the input in the same way.
An unadjusted version uses raw net advances.
A ratio-adjusted version divides net advances by the total number of advancing and declining issues.
Some versions multiply the ratio-adjusted result by 1,000 to make the displayed numbers larger.
| Version | Input | What changes |
|---|---|---|
| Unadjusted | Advances - Declines | Values depend more on the size of the market universe |
| Ratio-adjusted | (Advances - Declines) / (Advances + Declines) | More comparable across time as listings change |
| Ratio-adjusted × 1,000 | Same ratio, scaled up | Same shape, larger printed values |
For the Python example later in this guide, I use McClellan Financial Publications’ daily spreadsheet and calculate the oscillator from the NYSE advances and declines columns. I then compare that result with the spreadsheet’s own pre-calculated McClellan A-D Oscillator column. That is a useful check because it shows whether the code is producing the same shape and broadly the same values as the published data.
The formula explains why the McClellan Oscillator is a breadth momentum indicator. It does not ask whether the index price is up or down. It asks whether short-term breadth is improving or weakening relative to slower breadth.
That makes it useful when an index move looks strong on the surface but participation underneath is narrowing, or when breadth starts improving before the index price fully turns.
How to Interpret McClellan Oscillator Signals
The McClellan Oscillator is best read as a breadth momentum indicator.
A positive reading means the faster breadth average is above the slower breadth average. Breadth is improving on a shorter-term basis.
A negative reading means the faster breadth average is below the slower breadth average. Breadth is weakening on a shorter-term basis.
That does not mean every zero-line cross is a trade. A market can have improving breadth while price is still below resistance. It can also have weakening breadth while the headline index is still rising.
| McClellan reading | Possible interpretation | Main caution |
|---|---|---|
| Above zero | Short-term breadth is stronger than slower breadth | Price may still face resistance |
| Below zero | Short-term breadth is weaker than slower breadth | Market may already be oversold |
| Crosses above zero | Breadth momentum is improving | Can whipsaw in choppy markets |
| Crosses below zero | Breadth momentum is deteriorating | Needs confirmation from index price |
| Strong positive reading | Broad upside participation | Can also mark short-term breadth overextension |
| Strong negative reading | Broad downside participation | Can also mark washout conditions |
The most useful readings often come from disagreement between price and breadth.
If an index makes a new high but the McClellan Oscillator fails to confirm, participation may be narrowing. That can warn that fewer stocks are supporting the move.
If an index makes a new low but the oscillator makes a higher low, breadth may be improving underneath the surface. That can warn that selling pressure is becoming less broad.
Those signals are warnings, not complete trades. Breadth can diverge for a while before price turns.
| Breadth setup | What it may suggest | What to check next |
|---|---|---|
| Index higher, oscillator weaker | Rally participation may be narrowing | Resistance, volume, leadership breadth |
| Index lower, oscillator stronger | Selling pressure may be narrowing | Support, failed breakdown, risk appetite |
| Oscillator turns up from deep negative territory | Breadth washout may be easing | Whether price has stopped falling |
| Oscillator turns down from high positive territory | Upside participation may be fading | Whether price is rejecting resistance |
| Oscillator chops around zero | Breadth momentum lacks direction | Avoid overreading short-term crosses |
I would use the McClellan Oscillator to judge market backdrop rather than single-stock entries. If breadth is improving, long setups in individual stocks may have a healthier market behind them. If breadth is deteriorating, even strong-looking stocks may be fighting a weaker broad tape.
The oscillator can also help explain why an index move feels fragile. If price is rising but breadth is weakening, the index may be relying on fewer large components. If price is falling but breadth is improving, selling pressure may be less widespread than the index chart suggests.
McClellan Oscillator Trading Strategy Examples
A McClellan Oscillator strategy should start with the market backdrop, not an individual stock setup.
The oscillator is based on breadth. It is trying to show whether participation across the market is improving or deteriorating. That makes it useful for filtering index trades, broad-market risk exposure, and the quality of single-stock signals.
If breadth is improving, bullish setups may have a healthier backdrop. If breadth is weakening, long trades may have less support from the broader market.
Sector breadth can add another layer. If the broad index is rising but only one or two sectors are carrying participation, the McClellan Oscillator may look weaker than the headline index suggests.
| Strategy idea | What the trader watches | Main risk |
|---|---|---|
| Breadth confirmation | Index rises while the oscillator also improves | Signal can lag after a fast move |
| Bullish divergence | Index makes a lower low but oscillator makes a higher low | Divergence can appear early |
| Bearish divergence | Index makes a higher high but oscillator makes a lower high | Narrow leadership can persist |
| Breadth thrust | Oscillator moves sharply up from a weak reading | Move may already be extended |
| Risk filter | Avoid new long exposure when breadth weakens | Can keep trader cautious during a grind higher |
A bullish breadth-confirmation setup might have the index breaking higher while the McClellan Oscillator is also rising. That suggests the move is not only being pushed by a small number of large stocks.
A bearish warning can appear when the index makes new highs but the oscillator does not confirm. That can mean participation is narrowing, even though the headline index still looks strong.
A bullish divergence can appear when the index makes a lower low but the oscillator makes a higher low. That does not mean the market has bottomed, but it can warn that downside participation is weakening.
For risk management, the oscillator can help a trader decide whether to press trades or step back. If breadth is deteriorating, a trader may want fewer long positions, smaller size, or stronger confirmation before acting.
| Setup | Possible trigger | Confirmation to watch |
|---|---|---|
| Bullish breadth confirmation | Index breaks higher and oscillator rises | Broad participation, strong close, leadership improving |
| Bearish breadth warning | Index rises but oscillator weakens | Narrow leadership, failed breakout, weak internals |
| Bullish divergence | Index makes a lower low; oscillator makes a higher low | Support hold, failed breakdown, risk appetite returning |
| Bearish divergence | Index makes a higher high; oscillator makes a lower high | Resistance rejection, weaker participation |
| Breadth washout recovery | Oscillator turns up from deep negative territory | Price stabilisation and follow-through |
The main thing I would avoid is using the McClellan Oscillator as a standalone buy or sell system. It can show improving or deteriorating participation, but the trade still needs price structure, risk control and awareness of the broader market environment.
McClellan Oscillator vs McClellan Summation Index
The McClellan Oscillator and McClellan Summation Index are closely related, but they are used for different jobs.
The McClellan Oscillator is the shorter-term breadth momentum reading. It moves above and below zero as the faster breadth average moves above or below the slower breadth average.
The McClellan Summation Index is the cumulative version. It adds each McClellan Oscillator reading to a running total. That makes it slower and more useful for judging the broader breadth trend.
In simple terms, the oscillator shows the shorter-term push in breadth. The Summation Index shows the longer-running accumulation of those breadth pushes.
\text{Summation Index}_t = \text{Summation Index}_{t-1} + \text{McClellan Oscillator}_tThe McClellan Summation Index equals the previous Summation Index value plus the latest McClellan Oscillator value.
| Tool | Main job | What it shows | Main caution |
|---|---|---|---|
| McClellan Oscillator | Shorter-term breadth momentum | Whether breadth is improving or weakening now | Can swing quickly around zero |
| McClellan Summation Index | Longer-term breadth trend | Whether breadth has been accumulating or deteriorating over time | Can react slowly after a turn |
| Oscillator above zero | Short-term breadth is positive | Participation is improving | Price may still face resistance |
| Summation Index rising | Broader breadth trend is improving | More sustained participation | May lag fast reversals |
| Divergence in either | Breadth does not confirm price | Possible warning sign | Divergence can persist |
A trader might use the McClellan Oscillator to spot short-term breadth turns, then use the Summation Index to judge whether the broader internal trend is improving or weakening.
For example, if the oscillator turns positive while the Summation Index is still falling, breadth may be improving in the short term but the bigger breadth trend may not have fully turned yet.
If both the oscillator and Summation Index are rising, the breadth backdrop is usually cleaner. Short-term breadth momentum and longer-term breadth trend are pointing in the same direction.
The reverse can also matter. If the headline index is rising but the Summation Index is falling, the rally may be narrowing under the surface. That does not guarantee an immediate reversal, but it is a warning that fewer stocks may be supporting the move.
| Breadth condition | Possible interpretation | What I would check |
|---|---|---|
| Oscillator rising, Summation Index rising | Short-term and longer-term breadth improving | Whether index price confirms |
| Oscillator rising, Summation Index falling | Short-term rebound inside weaker breadth trend | Follow-through and resistance |
| Oscillator falling, Summation Index rising | Short-term breadth pullback inside healthier trend | Whether weakness is temporary |
| Oscillator falling, Summation Index falling | Breadth momentum and trend both deteriorating | Risk exposure and support levels |
| Index rising, Summation Index falling | Narrowing participation | Leadership concentration and failed breakout risk |
I would not treat the Summation Index as a replacement for the oscillator. They answer different questions. The oscillator is better for shorter-term breadth turns. The Summation Index is better for judging whether those turns are becoming part of a broader internal market trend.
Pros and Cons of the McClellan Oscillator
The McClellan Oscillator is useful because it looks beneath the index price.
A headline index can rise while fewer stocks participate. It can also fall while internal breadth starts improving. The oscillator helps traders see those shifts by tracking advancing and declining issues.
| Strength | Why it helps |
|---|---|
| Measures market breadth | Shows whether participation is broad or narrow |
| Useful for divergence | Can warn when index price and market internals disagree |
| Helps judge market health | Shows whether breadth momentum is improving or weakening |
| Works with index analysis | Can support or question signals from major index charts |
| Links naturally to the Summation Index | Short-term breadth momentum can be compared with longer-term breadth trend |
The limitations mostly come from data and interpretation.
The oscillator needs advance/decline data, so it is not as easy to calculate from ordinary price data as indicators such as RSI or MACD. It also depends on the market universe being measured. NYSE breadth, Nasdaq breadth and S&P 500 breadth can tell different stories.
Signals can also arrive early. Breadth may weaken before price turns, or improve before price confirms. That makes the oscillator useful as a warning tool, but dangerous as a standalone entry trigger.
| Limitation | What can go wrong |
|---|---|
| Needs breadth data | Ordinary OHLC price data is not enough |
| Universe matters | NYSE, Nasdaq, S&P 500 or sector breadth can give different readings |
| Divergence can persist | Price may keep rising or falling after breadth warning appears |
| Can whipsaw around zero | Short-term breadth can change quickly in choppy markets |
| Scaling differs by platform | Ratio-adjusted and unadjusted versions may not match exactly |
| Not a single-stock signal | It is mainly a market backdrop indicator, not a stock-specific trigger |
Used well, the McClellan Oscillator can help a trader judge whether market participation is improving or deteriorating. Used badly, it can encourage trades based on breadth alone, without checking index price structure, sector leadership and risk conditions.
Coding the McClellan Oscillator with Python
The McClellan Oscillator is less plug-and-play than price-only indicators because it needs market breadth data.
A normal price download from Yahoo Finance gives open, high, low, close and volume. That is enough for indicators such as RSI, MACD or moving averages, but it is not enough for the McClellan Oscillator.
The example below uses McClellan Financial Publications’ daily oscillator spreadsheet. The file includes NYSE advancing and declining issues, DJIA closing values, the McClellan A-D Oscillator, the McClellan Summation Index, and related breadth fields.
That gives us two useful checks. First, we can calculate the oscillator ourselves from advances and declines. Second, we can compare our calculated line with McClellan’s own pre-calculated oscillator column.
Even McClellan Financial Publications notes that advance-decline data is not as clean or standardised as ordinary price data. Different vendors can report different breadth numbers because they may use different issue lists, prior closes, real-time prices or tabulation methods. McClellan uses WSJ/Barron’s data for final breadth numbers and warns that preliminary or intraday numbers can differ. That is why any McClellan Oscillator chart should state the breadth universe and data source being used.
Step 1: Download the daily oscillator spreadsheet
Download the Daily Oscillator Data spreadsheet from the McClellan Financial Publications website, under the Breadth Data section. The code below assumes the spreadsheet is saved in your Downloads folder as OSC-DATA.xls.
The spreadsheet includes NYSE advances, NYSE declines, the McClellan A-D Oscillator, the McClellan Summation Index, and DJIA close data. We will use the advances and declines to calculate our own oscillator, then compare it with the pre-calculated McClellan column.
Step 2: Install the Python libraries
python -m pip install pandas matplotlib xlrdIf your Windows setup uses the py launcher, this version may work better:
py -m pip install pandas matplotlib xlrdPandas reads and processes the spreadsheet, matplotlib builds the chart, and xlrd lets pandas open the older .xls spreadsheet format.
Step 3: Import the libraries and load the spreadsheet
from pathlib import Path
import pandas as pd
import matplotlib.pyplot as plt

file_name = Path.home() / "Downloads" / "OSC-DATA.xls"

if not file_name.exists():
    raise FileNotFoundError(f"Could not find the spreadsheet at: {file_name}")

column_names = [
    "Date",
    "NYSE_Advances",
    "NYSE_Declines",
    "NYSE_Up_Volume",
    "NYSE_Down_Volume",
    "DJIA_Close",
    "NYSE_AD",
    "Trend_10_AD",
    "Trend_5_AD",
    "McC_AD_Osc",
    "McC_Summation_Index",
    "AD_Osc_Unchanged_Today",
    "AD_Osc_To_Tomorrow",
    "NYSE_Up_Down_Volume",
    "Trend_10_UV_DV",
    "Trend_5_UV_DV",
    "McC_UV_DV_Osc",
    "UV_DV_Summation_Index",
    "UV_DV_Osc_Unchanged_Tomorrow",
    "UV_DV_Osc_To_Tomorrow",
    "Price_10_Trend",
    "Price_5_Trend",
    "Price_Oscillator",
    "Price_For_Unchanged_Oscillator"
]

raw_data = pd.read_excel(
    file_name,
    header=None,
    skiprows=6,
    usecols="A:X"
)

raw_data.columns = column_names

data = raw_data.copy()

data["Date"] = pd.to_datetime(data["Date"], errors="coerce")
data = data.dropna(subset=["Date"])
data = data.set_index("Date").sort_index()The spreadsheet has several title and header rows at the top, so the code skips the first six rows and then applies cleaner column names manually. The Date column is converted into a proper datetime index.
Step 4: Clean the useful columns
useful_columns = [
    "NYSE_Advances",
    "NYSE_Declines",
    "DJIA_Close",
    "McC_AD_Osc",
    "McC_Summation_Index"
]

for column in useful_columns:
    data[column] = pd.to_numeric(data[column], errors="coerce")

data = data.dropna(subset=["NYSE_Advances", "NYSE_Declines"])

if data.empty:
raise ValueError("No valid advance-decline data found in the spreadsheet.")This keeps the columns needed for the chart and turns them into numeric values. Rows without usable advance-decline data are removed.
Step 5: Calculate the McClellan Oscillator from advances and declines
data["Calculated_NYSE_AD"] = data["NYSE_Advances"] - data["NYSE_Declines"]

data["Calculated_10_Trend"] = data["Calculated_NYSE_AD"].ewm(
    alpha=0.10,
    adjust=False
).mean()

data["Calculated_5_Trend"] = data["Calculated_NYSE_AD"].ewm(
    alpha=0.05,
    adjust=False
).mean()

data["Calculated_McClellan_Osc"] = (
    data["Calculated_10_Trend"] - data["Calculated_5_Trend"]
)This calculation uses the unadjusted NYSE advance-decline difference, rather than the ratio-adjusted version, so it can be compared with the spreadsheet’s pre-calculated McClellan A-D Oscillator column.
The 10% trend is equivalent to the faster 19-period EMA. The 5% trend is equivalent to the slower 39-period EMA.
The spreadsheet already includes McClellan’s own 10% trend, 5% trend and McClellan A-D Oscillator columns. In this walkthrough, I calculate the 10% and 5% trends directly from NYSE advances and declines, then compare my result with the spreadsheet’s pre-calculated oscillator in the final chart.
Step 6: Compare the calculated oscillator with the spreadsheet value
data["Oscillator_Difference"] = (
    data["Calculated_McClellan_Osc"] - data["McC_AD_Osc"]
)

plot_data = data.dropna(
    subset=[
        "DJIA_Close",
        "Calculated_McClellan_Osc",
        "McC_AD_Osc",
        "Oscillator_Difference",
        "McC_Summation_Index"
    ]
).copy()

# Early rows can differ because EMAs need a warm-up period.
# If the file has enough history, remove the first 100 usable rows for a cleaner comparison.
if len(plot_data) > 120:
    plot_data = plot_data.iloc[100:].copy()

if plot_data.empty:
raise ValueError("Not enough valid rows to plot the McClellan Oscillator.")The difference column compares our calculated oscillator with the published oscillator column. Early rows can differ because EMA calculations need a warm-up period, so the code removes the first 100 usable rows when enough history is available.
Step 7: Plot the comparison chart
fig, (ax_price, ax_osc, ax_diff, ax_sum) = plt.subplots(
    4,
    1,
    figsize=(12, 8),
    sharex=True,
    gridspec_kw={
        "height_ratios": [3, 1.5, 1, 1.5],
        "hspace": 0.0
    }
)

fig.suptitle(
    "McClellan Oscillator from NYSE Advance-Decline Data",
    fontsize=12,
    fontweight="bold"
)

ax_price.plot(
    plot_data.index,
    plot_data["DJIA_Close"],
    label="DJIA Close",
    color="black",
    linewidth=1.2
)

ax_price.set_ylabel("DJIA")
ax_price.legend(loc="upper left", fontsize=8)
ax_price.grid(True, alpha=0.25)

ax_osc.plot(
    plot_data.index,
    plot_data["Calculated_McClellan_Osc"],
    label="Calculated McClellan Oscillator",
    color="blue",
    linewidth=2
)

ax_osc.plot(
    plot_data.index,
    plot_data["McC_AD_Osc"],
    label="Spreadsheet McClellan Oscillator",
    color="yellow",
    linestyle="--",
    linewidth=1.5
)

ax_osc.axhline(
    0,
    color="black",
    linestyle="--",
    linewidth=0.8,
    alpha=0.8
)

ax_osc.set_ylabel("Oscillator")
ax_osc.legend(loc="upper left", fontsize=8)
ax_osc.grid(True, alpha=0.25)

ax_diff.plot(
    plot_data.index,
    plot_data["Oscillator_Difference"],
    label="Calculated - Spreadsheet",
    color="purple",
    linewidth=1.0
)

ax_diff.axhline(
    0,
    color="black",
    linestyle="--",
    linewidth=0.8,
    alpha=0.8
)

ax_diff.set_ylabel("Difference")
ax_diff.legend(loc="upper left", fontsize=8)
ax_diff.grid(True, alpha=0.25)

ax_sum.plot(
    plot_data.index,
    plot_data["McC_Summation_Index"],
    label="McClellan Summation Index",
    color="green",
    linewidth=1.1
)

ax_sum.set_ylabel("Summation")
ax_sum.legend(loc="upper left", fontsize=8)
ax_sum.grid(True, alpha=0.25)

fig.autofmt_xdate()

fig.subplots_adjust(
    top=0.92,
    bottom=0.12,
    left=0.08,
    right=0.97,
    hspace=0.0
)

output_file = "mcclellan_oscillator_comparison.png"
fig.savefig(output_file, dpi=150, bbox_inches="tight")

print(f"Saved chart as {output_file}")

plt.show()The chart plots DJIA close, our calculated McClellan Oscillator, McClellan’s pre-calculated oscillator value, the difference between the two, and the McClellan Summation Index.
Step 8: Run the script
Save the file as mcclellan_oscillator.py (in your downloads folder ideally), keep OSC-DATA.xls in the same folder, then run:
python mcclellan_oscillator.pyOr, on some Windows setups:
py mcclellan_oscillator.pyYou should get a multi-panel chart comparing your calculated McClellan Oscillator with the pre-calculated McClellan value from the spreadsheet. The two lines should be very similar after the EMA warm-up period. Small differences can occur if the spreadsheet has older history embedded in its existing trend values or if you start the calculation from a shorter data window.
Here is what it produced for me, your dates and therefore data will differ from mine:
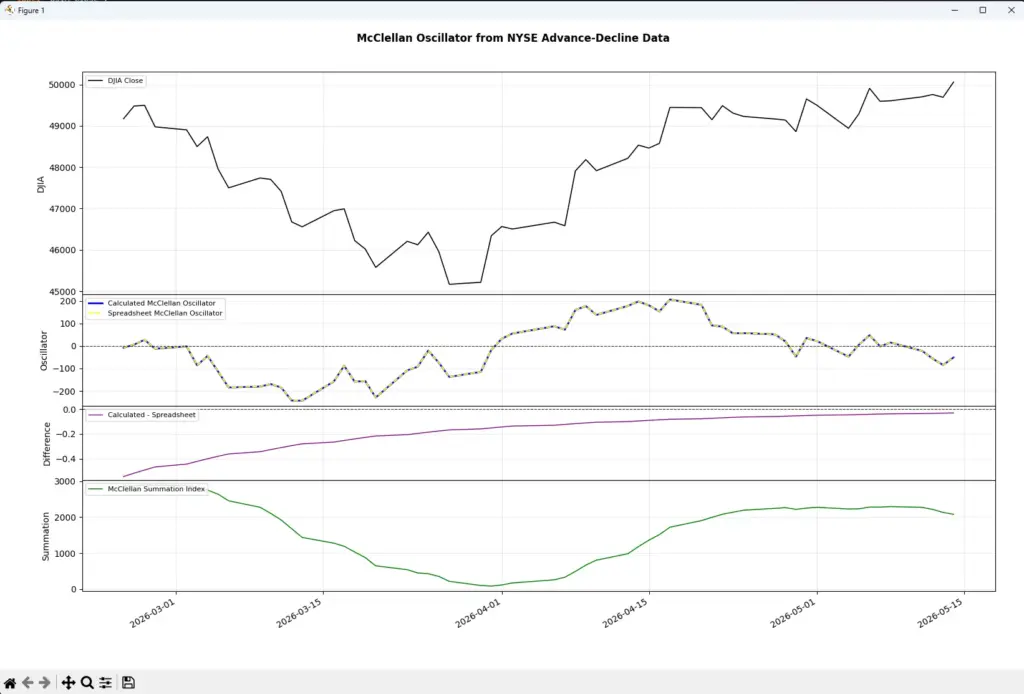
This chart is a useful check on the calculation. The blue calculated McClellan Oscillator and the dashed yellow spreadsheet oscillator are almost identical, which shows that the Python formula is matching the published spreadsheet closely. The small difference line is expected because EMA calculations depend on warm-up history and the spreadsheet may carry prior trend values from earlier data.
The top panel gives the DJIA close for price context. The oscillator panel shows short-term breadth momentum moving above and below zero. The bottom Summation Index panel gives the broader cumulative breadth trend. In this sample, breadth weakened into late March, then improved sharply through April before fading again into mid-May.
McClellan Oscillator vs RSI, MACD and ADX
The McClellan Oscillator is different from most indicators traders use on price charts.
RSI, MACD and ADX are usually calculated from price data. The McClellan Oscillator is calculated from market breadth data. It looks at advancing and declining issues rather than the price of one stock or index.
That means it is better used as a market backdrop tool than as a direct replacement for a price indicator.
| Indicator | Main job | How it differs from the McClellan Oscillator | Useful pairing idea |
|---|---|---|---|
| RSI | Measures price momentum and stretched conditions | RSI is calculated from price; McClellan is calculated from breadth | RSI can show whether an index is stretched while McClellan checks participation |
| MACD | Tracks moving-average momentum | MACD follows price trend; McClellan follows breadth momentum | MACD can confirm price momentum while McClellan checks market internals |
| ADX | Measures trend strength | ADX measures directional strength; McClellan measures advancing vs declining participation | ADX can help judge trend strength while McClellan checks whether participation supports it |
| Moving averages | Smooth price direction | Moving averages show price trend; McClellan shows breadth trend | Use moving averages for index trend and McClellan for internal confirmation |
| Advance/Decline Line | Cumulative breadth trend | A/D Line accumulates breadth; McClellan measures shorter-term breadth momentum | A/D Line gives the longer backdrop while McClellan shows shorter swings |
| Summation Index | Cumulative McClellan reading | Summation Index is slower and broader | Use it to confirm whether short-term breadth changes are becoming a larger trend |
A useful combination is price trend plus breadth confirmation.
For example, an index above a rising moving average with a rising McClellan Oscillator has a cleaner backdrop than an index making new highs while breadth weakens. The first setup suggests broader participation. The second may suggest a rally being carried by fewer stocks.
MACD can help with price momentum, while the McClellan Oscillator checks whether participation is improving underneath the surface.
ADX can also be useful, but it answers a different question. ADX can show whether a price trend has strength. The McClellan Oscillator can show whether that move is supported by more advancing stocks than declining stocks.
The cleanest approach is to give each tool a job. Price indicators help read the index chart. Breadth indicators help judge whether the index move has broad internal support.
| Question | Better tool |
|---|---|
| Is the index price trend rising or falling? | Moving averages or MACD |
| Is the index trend strong? | ADX |
| Is price stretched? | RSI or Bollinger Bands |
| Is participation improving or weakening? | McClellan Oscillator |
| Is breadth improving over a longer period? | McClellan Summation Index or Advance/Decline Line |
| Are fewer stocks supporting the index move? | McClellan divergence and breadth data |
The McClellan Oscillator is most useful when it adds information the price chart does not show. If the index is rising and breadth is improving, the move has broader support. If the index is rising while breadth weakens, the chart may be more fragile than the headline price suggests.
Frequently Asked Questions about the McClellan Oscillator
Q: What is the McClellan Oscillator?
The McClellan Oscillator is a market breadth indicator. It compares advancing and declining issues to show whether participation across the market is improving or weakening.
Q: What does the McClellan Oscillator measure?
It measures breadth momentum. A rising oscillator suggests short-term breadth is improving. A falling oscillator suggests short-term breadth is weakening.
Q: How is the McClellan Oscillator calculated?
It is usually calculated by taking a 19-period EMA of breadth and subtracting a 39-period EMA of breadth. The breadth input is often net advances or ratio-adjusted net advances.
Q: What are advances and declines?
Advances are the number of stocks that closed higher. Declines are the number of stocks that closed lower. The oscillator uses those counts to look beneath the headline index price.
Q: What does a positive McClellan Oscillator mean?
A positive reading means the faster breadth average is above the slower breadth average. Short-term breadth is stronger than longer-term breadth.
Q: What does a negative McClellan Oscillator mean?
A negative reading means the faster breadth average is below the slower breadth average. Short-term breadth is weaker than longer-term breadth.
Q: Is a zero-line cross a buy or sell signal?
Not by itself. A move above zero can show improving breadth, and a move below zero can show weakening breadth, but price structure still matters.
Q: What is McClellan Oscillator divergence?
Divergence happens when index price and breadth momentum disagree. For example, an index may make a new high while the oscillator fails to confirm. That can warn that participation is narrowing.
Q: What is the difference between the McClellan Oscillator and the McClellan Summation Index?
The oscillator is the shorter-term breadth momentum reading. The Summation Index is cumulative, so it gives a slower, broader view of the breadth trend.
Q: Can I calculate the McClellan Oscillator from normal price data?
No. Ordinary OHLC price data is not enough. You need advance and decline counts for the market universe being studied.
Final Thoughts
The McClellan Oscillator is useful because it asks a different question from most price indicators.
A price chart shows what the index did. A breadth indicator asks how many stocks took part. That matters because an index can rise while participation narrows, or fall while selling pressure becomes less broad.
The oscillator is strongest as a market-health tool. It can confirm broad participation, warn of narrowing rallies, highlight breadth divergence, and help traders judge whether individual setups have a supportive backdrop.
The main limitation is data. The oscillator depends on reliable advance and decline counts, and the market universe matters. NYSE breadth, Nasdaq breadth, S&P 500 breadth and sector breadth can all tell different stories.
I would not use the McClellan Oscillator as a standalone trading system. It is better as a breadth layer beside index price, support and resistance, trend structure, volume, and risk control.
Further Reading
Related AlphaSquawk guides:
ADX, for judging whether price action has enough trend strength to support directional trades.
RSI, for price momentum and stretched-condition analysis.
MACD, for moving-average momentum and crossover signals.
Moving Averages, for basic price trend filtering.
Bollinger Bands, for volatility bands around price.
Advance/Decline Line, for cumulative market breadth analysis.
Books and references:
“Patterns for Profit”, Sherman and Marian McClellan.
“Technical Analysis of Stock Trends”, Robert D. Edwards and John Magee.
“Technical Analysis of the Financial Markets”, John J. Murphy.
“The Complete Guide to Market Breadth Indicators”, Gregory L. Morris.


