
Updated May 2026: This CMF guide has been refreshed with clearer formula notes, scaling warnings, improved signal interpretation, and updated Python code guidance.
Introduction
Chaikin Money Flow, usually shortened to CMF, is a volume-based technical indicator developed by Marc Chaikin. It is designed to estimate buying and selling pressure over a chosen lookback period, commonly 20 or 21 bars.
The idea is straightforward enough. If a stock repeatedly closes near the top of its daily range on strong volume, CMF treats that as accumulation or buying pressure. If it repeatedly closes near the bottom of its range on strong volume, CMF treats that as distribution or selling pressure.
That does not mean CMF literally tracks cash moving in and out of a stock. It is a formula-based estimate built from close location and volume. Used properly, it can help traders confirm trends, question weak breakouts, and spot possible divergences between price and buying or selling pressure.
This guide explains how Chaikin Money Flow is calculated, how to interpret the zero line, where CMF can mislead you, how it compares with OBV and MFI, and how to code and plot it in Python.
Key Takeaways
- Chaikin Money Flow estimates buying and selling pressure by combining close location and volume.
- The Money Flow Multiplier is positive when price closes in the upper half of the high-low range and negative when it closes in the lower half.
- CMF is usually calculated over 20 or 21 periods.
- Some platforms display CMF between -1 and +1, while others multiply it by 100 and show it between -100 and +100.
- A CMF value above zero suggests buying pressure; a value below zero suggests selling pressure.
- A zero-line cross can be useful, but it can also whipsaw. Some traders use small buffers such as +0.05 and -0.05 on the unscaled version.
- CMF can be distorted by gaps because it focuses on where price closes within the current bar’s range, not the close-to-close change.
- CMF should be used with price structure, trend, volume context and other indicators rather than as a standalone trading signal.
Origins of the Chaikin Money Flow Indicator
This indicator is the brainchild of Marc Chaikin, a stock market analyst who has devoted his career to improving the tools available to traders. Marc Chaikin’s contributions to the field of technical analysis extend beyond the CMF Indicator, but it’s arguably one of his most influential creations.
The indicator was born out of Chaikin’s recognition of the crucial role that volume plays in trading. He understood that trading volume could provide valuable insights into the strength of a price move. This led him to develop an indicator that could measure the volume of capital flowing into and out of a security over a specific period.
Overall the Chaikin Money Flow Indicator was designed to provide a snapshot of the buying and selling pressure for a security.
Understanding the Indicator
Chaikin Money Flow is an oscillator that moves above and below a zero line.
On many platforms, CMF is shown between -1 and +1. Other platforms multiply the value by 100, so the same reading may appear between -100 and +100. For example, a CMF reading of 0.25 on one platform may be displayed as 25 on another. The meaning is the same; only the scale is different.
A positive CMF reading suggests buying pressure over the lookback period. A negative CMF reading suggests selling pressure.
The absolute level also matters. A barely positive CMF reading is not the same as a strong positive reading. Likewise, a move just below zero may be less meaningful than a sustained negative reading.
The zero line is useful, but it is not magic. CMF can flicker above and below zero in choppy markets, creating false signals. For that reason, some traders prefer to look for stronger confirmation, such as a move above a small positive threshold, a move below a small negative threshold, or agreement with price breaking support or resistance.
Mathematical Construction
Chaikin Money Flow is built from three parts: the Money Flow Multiplier, Money Flow Volume, and the final CMF value.
The calculation starts by asking where the close sits inside the period’s high-low range. It then weights that close-location score by volume and sums the result over a lookback period.
- Money Flow Multiplier (MFM): The Money Flow Multiplier measures where the close finished within the period’s high-low range.
MFM = [(Close - Low) - (High - Close)] / (High - Low)
MFM = \frac{(Close - Low) - (High - Close)}{High - Low}
this can also be written as:
MFM = (2 × Close - High - Low) / (High - Low)
MFM = \frac{(2 \times Close) - High - Low}{High - Low}If the close is near the high, the multiplier is positive. If the close is near the low, the multiplier is negative. If the close is near the middle of the range, the multiplier is close to zero.
The multiplier usually ranges from -1 to +1. A positive value suggests buying pressure inside that bar. A negative value suggests selling pressure inside that bar.
2. Money Flow Volume (MFV): The next step is to multiply the Money Flow Multiplier by volume.
MFV = MFM x Volume
MFV = MFM \times Volume
Money Flow Volume does not mean we know the exact cash moving into or out of the security. It is a formula-based estimate of buying or selling pressure, weighted by volume.
A high-volume bar that closes near its high adds positive Money Flow Volume. A high-volume bar that closes near its low adds negative Money Flow Volume.
3. Chaikin Money Flow (CMF): The final step is to sum Money Flow Volume over a lookback period and divide it by total volume over the same period.
CMF = Sum of Money Flow Volume over N periods / Sum of Volume over N periods
which is the same as:
CMF = \frac{\sum_{N}(MFV)}{\sum_{N}(Volume)}
A common CMF setting is 20 or 21 periods. Some charting platforms display CMF on a -1 to +1 scale. Others multiply the result by 100 and show it on a -100 to +100 scale.
CMF × 100 = [Sum of Money Flow Volume over N periods / Sum of Volume over N periods] × 100
CMF_{scaled} = \frac{\sum_{N}(MFV)}{\sum_{N}(Volume)} \times 100Both versions represent the same information. The only difference is the scale. A CMF reading of 0.25 on a -1 to +1 chart is the same as 25 on a -100 to +100 chart.
In this article’s Python example, we multiply CMF by 100 so the plotted line is easier to read on a -100 to +100 scale.
The practical interpretation is simple: CMF above zero suggests buying pressure over the lookback period, while CMF below zero suggests selling pressure.
The absolute value also matters. A barely positive reading is not the same as a strong sustained positive reading. Likewise, repeated movement just above and below zero can be noise rather than a useful signal.
One important limitation is that CMF focuses on where price closes inside the current bar’s range. It does not directly measure the close-to-close change. That means gaps can sometimes create odd readings. A stock can gap down sharply but close near the high of the day, causing CMF to improve even though price is still lower than the previous close.
Interpreting the CMF
The basic interpretation is straightforward:
CMF above zero suggests buying pressure.
CMF below zero suggests selling pressure.
Rising CMF suggests buying pressure is improving.
Falling CMF suggests selling pressure is increasing.
CMF is often used to confirm or question price action. For example, if price is breaking higher and CMF is positive, the breakout may have better volume support. If price is rising but CMF is negative or falling, the move may deserve more caution.
Divergence is another common use. If price makes a higher high but CMF makes a lower high, buying pressure may be weakening. If price makes a lower low but CMF makes a higher low, selling pressure may be fading.
The warning is that CMF should not be treated as an order button. A positive reading does not guarantee price will rise, and a negative reading does not guarantee price will fall. It is a pressure gauge, not a complete trading system.
Pros and Cons
Like any technical indicator, Chaikin Money Flow has strengths and weaknesses.
Pros
Volume-aware: CMF includes volume, so it can help traders judge whether price movement is being supported by stronger buying or selling pressure.
Useful for confirmation: Positive CMF can help confirm an uptrend or breakout, while negative CMF can question the strength of a rally.
Simple zero-line logic: Readings above zero suggest buying pressure, while readings below zero suggest selling pressure.
Helpful for divergence: CMF divergence can warn that price and volume pressure are no longer confirming each other.
Useful in screeners: CMF can be coded into scans looking for improving or deteriorating money flow.
Cons
Gap sensitivity: CMF focuses on where the close sits inside the current high-low range. A stock can gap down sharply but close near the top of the day’s range, causing CMF to rise even though price is still lower.
Scale differences: Some platforms show CMF from -1 to +1, while others show -100 to +100. Traders need to know which version they are using.
Whipsaws around zero: CMF can flicker above and below zero in choppy markets.
Lookback sensitivity: A short CMF reacts faster but may be noisy. A longer CMF is smoother but slower.
Not a standalone signal: CMF needs price context, trend, support/resistance, volume behaviour and risk management.
Comparison with Other Indicators
CMF is often compared with OBV and MFI because all three use volume, but they answer different questions.
OBV is cumulative and focuses on whether price closed higher or lower than the previous close.
CMF focuses on where the close finished inside the high-low range, then weights that by volume.
MFI uses price and volume to create a momentum oscillator that is often interpreted more like a volume-weighted RSI.
None is automatically better. The useful question is what you want the indicator to tell you.
| Feature / Indicator | Chaikin Money Flow (CMF) | On Balance Volume (OBV) | Money Flow Index (MFI) |
|---|---|---|---|
| Main question | Is recent volume-weighted close location showing buying or selling pressure? | Is volume accumulating on up closes or down closes? | Is volume-weighted momentum becoming overbought or oversold? |
| Core input | High, low, close and volume | Close and volume | Typical price and volume |
| Calculation idea | Money Flow Multiplier × volume, summed over a lookback period and divided by total volume | Add volume on up closes and subtract volume on down closes | Compare positive and negative money flow, then convert the ratio into an oscillator |
| Scale | Usually -1 to +1, or -100 to +100 if multiplied by 100 | Cumulative line with no fixed upper/lower bound | 0 to 100 |
| Key strength | Good for judging buying/selling pressure behind a move | Simple way to track volume confirmation over time | Combines price and volume in an RSI-style oscillator |
| Key weakness | Can be distorted by gaps and close-location quirks | Ignores where price closed inside the day’s range | Can give overbought/oversold-style false signals in strong trends |
| Best used for | Confirming or questioning price trends and breakouts | Confirming broader accumulation/distribution trends | Spotting volume-weighted momentum extremes and divergence |
Coding the Indicator
In this section, we’ll code Chaikin Money Flow in Python and plot it underneath a candlestick chart.
We will use:
yfinanceto download price and volume data;pandasto organise and calculate the data;numpyto handle numerical edge cases;mplfinanceto create the candlestick chart;matplotlibto add a clean legend.
The Python example below plots CMF on a -100 to +100 scale by multiplying the final CMF value by 100. If you prefer the common -1 to +1 scale, you can remove the * 100 part in the function.
If you have more than one Python version installed, use python -m pip install rather than plain pip install. That helps make sure the packages are installed into the same Python environment that VSCode is using.
python -m pip install yfinance pandas numpy mplfinance matplotlibCreate a new .py file, perhaps called cmf_chart.py, and paste each code block below into the file in order.
Here’s a step-by-step guide:
Step 1: Import the necessary libraries
import numpy as np
import pandas as pd
import yfinance as yf
import mplfinance as mpf
import matplotlib.pyplot as plt
from matplotlib.lines import Line2DThese libraries do the following:
Line2Dlets us create custom legend lines for CMF and the zero line.numpyhandles numerical operations and edge cases.pandasstores and manipulates the price data.yfinancedownloads stock data from Yahoo Finance.mplfinancecreates the candlestick and volume chart.matplotlib.pyplotdisplays the chart.
Step 2: Define the function to calculate the CMF
Beneath the import lines above, add the following:
def calculate_cmf(data, lookback=21, scale=100):
    """
    Calculate Chaikin Money Flow.

    data:
        pandas DataFrame with High, Low, Close and Volume columns.

    lookback:
        Number of periods used for the CMF calculation.
        20 or 21 periods are commonly used.

    scale:
        Use 100 for a -100 to +100 style plot.
        Use 1 for the common -1 to +1 scale.
    """

    data = data.copy()

    high_low_range = data["High"] - data["Low"]

    # Money Flow Multiplier
    mfm = ((data["Close"] - data["Low"]) - (data["High"] - data["Close"])) / high_low_range
    mfm = mfm.replace([np.inf, -np.inf], 0).fillna(0)

    # Money Flow Volume
    mfv = mfm * data["Volume"]

    # Chaikin Money Flow
    cmf = (mfv.rolling(window=lookback).sum() / data["Volume"].rolling(window=lookback).sum()) * scale
    cmf = cmf.replace([np.inf, -np.inf], 0)

return cmfThis function follows the three-part CMF calculation:
First, it calculates the Money Flow Multiplier, which tells us where the close sits inside the day’s high-low range.
Second, it multiplies that value by volume to create Money Flow Volume.
Third, it sums Money Flow Volume over the lookback period and divides it by total volume over the same period.
The line:
mfm = mfm.replace([np.inf, -np.inf], 0).fillna(0)is there because some bars can have the same high and low. That would otherwise cause a divide-by-zero problem.
This version uses scale=100, so the plotted CMF line appears on a -100 to +100 scale. To plot the unscaled version, use scale=1.
Step 3: Fetch the stock data
ticker = "RIOT"

data = yf.download(
    ticker,
    start="2024-01-01",
    auto_adjust=False,
    progress=False
)

# yfinance can sometimes return MultiIndex columns, so flatten them if needed.
if isinstance(data.columns, pd.MultiIndex):
    data.columns = data.columns.get_level_values(0)

data = data.dropna()This downloads recent daily data for Riot Platforms from Yahoo Finance.
You can replace:
ticker = "RIOT"with another ticker if you want to test a different stock or ETF.
The auto_adjust=False setting keeps the normal OHLC columns visible, which is useful when learning how the calculation works.
The MultiIndex check is included because some versions of yfinance return column names in a slightly different format. Flattening the columns helps avoid errors later.
Step 4: Calculate the CMF and add a zero line
data["CMF"] = calculate_cmf(data, lookback=21, scale=100)
data["Zero Line"] = 0Here we calculate a 21-period Chaikin Money Flow and add a zero line.
The zero line matters because CMF above zero suggests buying pressure over the lookback period, while CMF below zero suggests selling pressure.
Because this code uses scale=100, the CMF line is shown on a -100 to +100 style scale.
Step 5: Prepare the chart panels
add_plots = [
    mpf.make_addplot(
        data["CMF"],
        panel=2,
        color="b",
        secondary_y=False,
        ylabel="CMF"
    ),
    mpf.make_addplot(
        data["Zero Line"],
        panel=2,
        color="black",
        secondary_y=False,
        linestyle="dashed"
    )
]

# Main price panel, volume panel, CMF panel
# These are relative sizes, not exact pixel heights.
panel_sizes = (5, 1.5, 3)This prepares the extra lines that will be added underneath the candlestick chart.
The first extra plot is the CMF line. The second is the dashed zero line.
The panel_sizes setting controls the relative size of each panel:
3 gives the CMF panel enough room to read clearly.
5 gives the price chart the most space;
1.5 gives the volume panel less space;
Step 6: Create the chart
fig, axes = mpf.plot(
    data,
    type="candle",
    style="yahoo",
    addplot=add_plots,
    volume=True,
    volume_panel=1,
    panel_ratios=panel_sizes,
    title=f"{ticker} with Chaikin Money Flow",
    ylabel="Price",
    figratio=(12, 8),
    figscale=1.1,
    returnfig=True
)This creates the main chart.
It plots:
- candlesticks in the top panel;
- volume in the middle panel;
- CMF and the zero line in the lower panel.
The returnfig=True setting gives us access to the chart axes, which lets us add a legend in the next step.
Step 7: Add a legend and show the plot
legend_lines = [
    Line2D([0], [0], color="b", lw=1.5, linestyle="solid"),
    Line2D([0], [0], color="black", lw=1.5, linestyle="dashed")
]

axes[2].legend(
    legend_lines,
    ["CMF", "Zero Line"],
    loc="lower left"
)

plt.show()This adds a small legend to the CMF panel and then displays the chart.
If your version of mplfinance gives an error on this line:
axes[2].legend(...)replace it with:
axes[-1].legend(
    legend_lines,
    ["CMF", "Zero Line"],
    loc="lower left"
)Different mplfinance versions can return the axes list slightly differently.
If all has gone to plan you can now save your .py file and execute the code (pressing the play icon in top right of VSCode is one way to do this) to create a chart that will look the same as mine below:
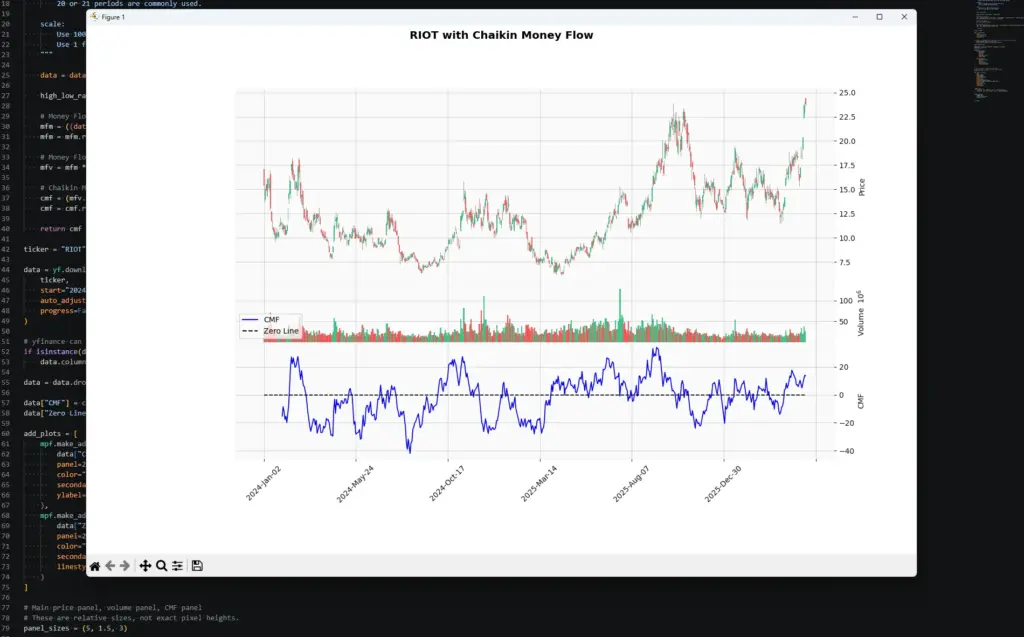
The chart shows Chaikin Money Flow underneath the price and volume panels. The blue line is CMF, and the dashed black line is zero.
In this example, CMF is plotted on a -100 to +100 scale because the function multiplies the final value by 100. If you remove the scaling, the same indicator will usually appear on a -1 to +1 scale instead.
The basic interpretation is simple: CMF above zero suggests buying pressure over the lookback period, while CMF below zero suggests selling pressure. The stronger and more persistent the reading, the more meaningful it is likely to be.
A quick move above or below zero can be noise, especially in choppy markets. This is why CMF is usually more useful when combined with price structure, trend, volume context, support and resistance, or another confirmation tool.
Using Chaikin Money Flow for a Screener
Once you can calculate CMF in Python, you are not limited to plotting one chart at a time. The same logic can be expanded into a simple stock screener.
For example, you could scan a list of tickers for:
- CMF crossing above zero;
- CMF crossing below zero;
- CMF staying positive while price breaks resistance;
- CMF improving while price is still consolidating;
- bearish divergence, where price rises but CMF weakens;
- bullish divergence, where price falls but CMF improves.
The point of a screener is not to create an automatic buy or sell signal. It is to reduce the number of charts you need to inspect manually. A CMF scan can flag stocks where buying or selling pressure may be changing, but the trade still needs to be checked against price structure, trend, volume, news and risk.
This is where coding becomes useful. You can combine CMF with other filters, such as moving averages, RSI, Bollinger Bands, Donchian breakouts, or candlestick patterns. Instead of relying on a broker’s default scan, you can build alerts around the conditions that actually matter to your trading process.
For example, a more selective scan might look for a stock trading above its rising 50-day moving average, with CMF above zero, and price breaking out of a recent range. That is much more useful than simply buying every stock with a positive CMF reading.


