
Updated May 2026: This guide has been refreshed with a clearer explanation of current-candle vs previous-candle Donchian Channel calculations, plus a more practical breakout strategy section.

Introduction
The Donchian Channel is a simple price-channel indicator that marks the highest high and lowest low over a chosen lookback period, often 20 periods, such as 20 daily candles. Traders mainly use it to spot breakouts, define trend-following entries, and judge whether volatility is expanding or contracting.
The important detail is how the channel is calculated. If the current candle is included, historical breakouts can appear to disappear from the chart. If the channel is based only on previous candles, breakouts are easier to see and test. That small difference matters when you move from looking at a chart to building a trading rule.
In this guide, we’ll cover how the Donchian Channel is calculated, how breakout signals are usually interpreted, where false signals occur, and how to code the indicator in Python without accidentally looking ahead.
Key takeaways
- A Donchian Channel plots the highest high and lowest low over a chosen lookback period.
- A break above the upper channel is often treated as a bullish breakout; a break below the lower channel is often treated as a bearish breakout.
- For trading rules and backtests, many traders calculate the channel from previous bars only, excluding the current bar.
- The Donchian Channel is simple, but it needs risk management because sideways markets can produce repeated false breakouts.
Origins of the Donchian Channel
The Donchian Channel is named after Richard Donchian, a commodities and futures trader born in 1905. Donchian is often referred to as the “Father of Trend Following”, which is a useful clue to how this indicator should be understood. It comes from a world of rule-based trading, futures markets and price breakouts, not from a modern social-media trading fad.
Donchian began his Wall Street career during the 1930s, a period when markets had been shaped by the crash, the Depression and major economic uncertainty. His work helped popularise a more systematic way of thinking about trading: define the rule, apply it consistently, and avoid making every decision from instinct or market gossip.
The Donchian Channel follows that same logic. It does not try to predict fair value or guess what a market “should” be worth. It simply asks: what was the highest high over the chosen period, what was the lowest low, and has price moved beyond that range?
That made the indicator especially relevant in commodity and futures markets, where trends can sometimes run much further than feels comfortable. A breakout trader using this kind of approach is often not trying to buy cheap and sell expensive. They are trying to join a move once price has broken into new territory.
The Donchian Channel later became associated with the Turtle Traders, the famous 1980s experiment in rule-based trend following. The Turtles were taught to follow mechanical trading rules, including breakout-style logic. That connection helped cement the Donchian Channel’s reputation as a practical trend-following tool rather than just another chart overlay.
So the history is not just trivia. It explains why the Donchian Channel is still used by traders building screeners, backtests and breakout strategies today: it turns recent price extremes into objective trading levels.
Mathematical Construction of the Donchian Channel
The Donchian Channel is a relatively simple yet powerful indicator. It consists of an upper band, a lower band, and often includes the middle band, which is the average of the upper and lower bands. The mathematical construction of the Donchian Channel is straightforward and involves the following steps:
Upper Band: The upper band of the Donchian Channel is calculated by taking the highest price of a security over a set number of periods, typically 20. This is represented mathematically as:
Upper\ Band_t = \max(High_{t-n+1}, \ldots, High_t)Here, t represents the current bar or candle, and n represents the lookback period. So Upper Bandₜ is the highest high from the last n periods, including the current period.
Upper Bandₜ = highest high over the last n periods
Lower Band: The lower band is calculated by taking the lowest price of a security over the same number of periods. This is represented mathematically as:
Lower\ Band_t = \min(Low_{t-n+1}, \ldots, Low_t)Here, Lower Bandₜ is the lowest low from the last n periods, including the current period.
Lower Bandₜ = lowest low over the last n periods
Middle Band: The middle band is the average of the upper and lower bands. This is represented mathematically as:
Middle\ Band_t = \frac{Upper\ Band_t + Lower\ Band_t}{2}The middle band is simply the average of the upper and lower Donchian bands at the current bar.
Middle Bandₜ = (Upper Band + Lower Band) / 2
For backtesting or breakout detection, some traders prefer to exclude the current candle. In that case, the previous-period version is:
Upper\ Band_t = \max(High_{t-n}, \ldots, High_{t-1})Lower\ Band_t = \min(Low_{t-n}, \ldots, Low_{t-1})This version compares the current price with the previous n-period range, rather than letting the current candle become part of the channel it is trying to break.
In these formulas, ‘n’ represents the lookback period, which is the number of periods over which the highs and lows are considered. This is typically set to 20, but can be adjusted based on the trader’s preferences and the characteristics of the security being traded.
The upper and lower bands form a channel around price. A wide channel means the recent high and recent low are far apart, which usually reflects higher volatility. A narrow channel means price has been moving inside a tighter recent range.
For a standard Donchian breakout strategy, the upper band is not automatically treated as “overbought” and the lower band is not automatically treated as “oversold”. A move above the upper band may instead be read as a sign of strength, while a move below the lower band may be read as a sign of weakness.
Some traders can use Donchian Channels in mean-reverting markets, such as pairs, spreads or range-bound instruments, but that is a different use case. In this guide, the main focus is the breakout interpretation: using the bands to define recent price extremes and identify when price has moved beyond them.
While the calculation is simple, the trading decision still requires judgement. A Donchian Channel can show where the recent range sits, but it does not tell you by itself whether the breakout is worth taking, how large the position should be, or where the trade should be exited.
Purpose and Design of the Donchian Channel
The Donchian Channel serves a dual purpose in technical analysis. It is designed to identify potential price breakouts, and it also provides insights into market volatility. By doing so, it helps traders formulate effective strategies to capitalize on market trends, making it a worthy piece of kit for many traders.
Identifying Price Breakouts
The primary purpose of the Donchian Channel is to identify potential price breakouts. A breakout occurs when the price of a security moves above the upper band or below the lower band of the Donchian Channel. This is often interpreted as a signal that the current trend is likely to continue.
If you look at a typical Donchian Channel chart, past breakouts may not be visible in the way you expect. This can seem confusing at first.
A “breakout” in the context of Donchian Channels means price has moved above the highest high, or below the lowest low, of the previous lookback period. If you are using a 20-period Donchian Channel, an upside breakout means price has moved above the previous 20-period high.
However, if the current candle is included in the channel calculation, the breakout candle immediately becomes part of the channel. The upper band adjusts to the new high, or the lower band adjusts to the new low. On the chart, the breakout can then look like price merely touched the band rather than moved beyond it.
This is why some Donchian Channel charts appear to show no historical breakouts, while others show them clearly.
For example, the chart below uses a one-minute Nasdaq chart around the July 2023 Non-Farm Payrolls release. The previous day’s ADP employment report had been much stronger than expected, so traders were watching the official payrolls number closely. When the NFP figure came in weaker than the ADP report had implied, volatility expanded quickly.
That is exactly the sort of market situation where the Donchian Channel becomes visually useful. Before the release, the channel is relatively tight because price is moving inside a narrow range. After the release, price breaks out and the channel expands as the market absorbs the new information.
The chart also shows the calculation issue discussed above. When the channel is plotted using only previous candles, the breakout is easier to see. The current price can move beyond the channel because the current candle has not yet been allowed to redefine the band.
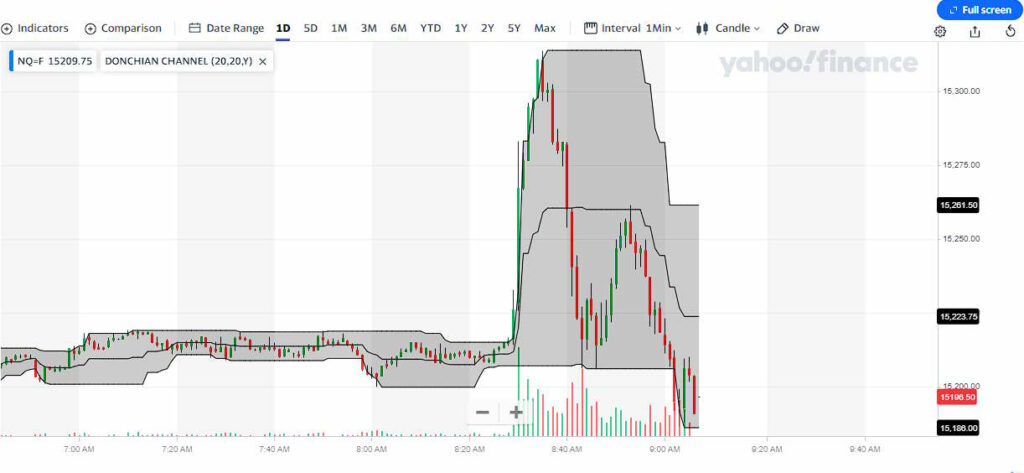
This is a fairly common method to plot the channel based on the high and low of the previous ‘n’ periods, not including the current period. This would mean that the channel for the current period is based on the high and low of the previous ‘n’ periods, and therefore the current price can breach the channel. This method can make it easier to visually identify breakouts when they occur, as seen above.
Assessing Market Volatility
The same chart also shows another useful feature of the Donchian Channel: it gives a quick visual read on volatility.
The width of the channel is the distance between the upper band and the lower band. When the channel is narrow, the market has been trading inside a tighter recent range. When the channel widens, the recent high and low are further apart, which means the market has become more volatile.
This is exactly what can happen around scheduled economic releases. Before a major number such as Non-Farm Payrolls, traders may wait for the data and the market can become quiet. In that waiting period, the Donchian Channel may narrow. Once the data is released, price can move sharply, and the channel expands as the new high or low enters the lookback window.
That is why the chart above is useful. It is not just showing a neat textbook pattern. It shows a real market event where the channel was narrow before the release and then expanded as traders reacted to the new information.
A wide channel is not automatically bullish or bearish. It simply tells you that the recent trading range has expanded. The trading signal comes from where price breaks, whether the move follows through, and how the trader manages the risk.
The practical lesson is that two Donchian Channel charts can use the same lookback period but show breakouts differently, depending on whether the current candle is included. That matters if you are comparing platforms, writing a screener, or backtesting a breakout rule.
How to Find Buy and Sell Signals with the Donchian Channel
The Donchian Channel gives clean trading levels, but the signal depends on how you define the breakout.
A basic bullish signal occurs when price closes above the upper channel. If you are using a 20-period Donchian Channel, that means price has closed above the previous 20-period high.
A basic bearish signal occurs when price closes below the lower channel. That means price has closed below the previous 20-period low.
The word “closes” matters. If price briefly trades above the upper band during the candle but falls back inside the channel before the close, the breakout is weaker. Waiting for a close beyond the channel can reduce some false signals, although it also means entering later.
For a long trade, a trader might use:
- entry: price closes above the previous 20-period high;
- initial risk: a stop below the breakout candle, below the middle band, or below a volatility-based level such as ATR;
- exit: price closes below the lower Donchian band, or below another predefined exit level.
For a short trade, the logic is reversed:
- entry: price closes below the previous 20-period low;
- initial risk: a stop above the breakout candle, above the middle band, or above a volatility-based level;
- exit: price closes above the upper Donchian band, or above another predefined exit level.
The Donchian Channel does not tell you whether every breakout is worth taking. It gives you the level. The trader still has to decide whether the market is trending, whether volatility is suitable, and how much risk to take on the trade.
Pros and Cons of Using the Donchian Channel
Like any trading tool, the Donchian Channel has its strengths and weaknesses. Understanding these can help you make the most of this indicator.
Pros
- Easy to Interpret: The Donchian Channel is straightforward to calculate and easy to understand, making it accessible to traders of all experience levels.
- Adaptable: It can be used in various markets, including stocks, forex, commodities, and bonds. It’s also effective over different timeframes, from intraday to long-term trading.
- Identifying Breakouts: The Donchian Channel is excellent at identifying potential price breakouts, which can be valuable for trend-following strategies.
- Assessing Volatility: The width of the Donchian Channel can provide quick, visual insights into market volatility, aiding in risk management.
Cons
- Noise Sensitivity: The Donchian Channel can be sensitive to price noise, especially in volatile markets. This can lead to the generation of false signals, where the price appears to break the channel, but no sustained trend follows.
- Requires Confirmation: The Donchian Channel, by itself, does not provide enough information for reliable trading decisions. It often needs to be used in conjunction with other indicators or strategies to confirm signals and avoid false positives.
- Limited Information: While the Donchian Channel is excellent for identifying potential breakouts and volatility, it does not provide information about other important factors such as momentum or trend strength.
- Dependent on Parameter Selection: The effectiveness of the Donchian Channel can be heavily influenced by the selection of the lookback period. An inappropriate choice of parameters can lead to poor performance.
Coding and Plotting the Donchian Channel in Python
The Donchian Channel is straightforward to code because it only needs rolling highs and rolling lows. In this example, we will use Python to download gold futures data, calculate a 20-period Donchian Channel, and plot it on a candlestick chart.
The example uses pandas, yfinance, mplfinance and matplotlib. I am using VSCode, but the same code can be run in another Python environment if you prefer. Everything used is available free of cost.
Step 1: Install the Python libraries
Before you start coding, you need to install the necessary Python libraries. Open VSCode, then open a new terminal (View -> Terminal). In the terminal, type the following commands to install the required libraries:
pip install pandas yfinance mplfinance matplotlibStep 2: Import the libraries
In a new Python file, start by importing the necessary libraries. This is done using the import statement.
import pandas as pd
import yfinance as yf
import mplfinance as mpf
import matplotlib.pyplot as pltStep 3: Download gold price data
Next, we’ll download the price data for Gold from Yahoo Finance. We’ll use the yf.download function, specifying the ticker symbol for Gold (‘GC=F’), and the start and end dates for the data we want to download.
# Download Gold price data from the start of the year to July 7th, 2023
data = yf.download('GC=F', start='2022-07-07', end='2023-07-07')Step 4: Calculate the Donchian Channel
Now we’ll calculate the Donchian Channels. The upper band is the highest high over the last 20 days, the lower band is the lowest low over the last 20 days, and the middle band is the average of the upper and lower bands. We’ll use the rolling and mean functions from pandas to calculate these.
# Calculate the upper band (highest high over the last 20 days)
data['UB'] = data['High'].rolling(window=20).max()

# Calculate the lower band (lowest low over the last 20 days)
data['LB'] = data['Low'].rolling(window=20).min()

# Calculate the middle band (average of the upper and lower band)
data['MB'] = (data['UB'] + data['LB']) / 2
If you want to use a shorter time horizon, you can change the window parameter to a smaller number. For example, if you want to use a 10-day Donchian Channel, you would change window=20 to window=10.
Step 5: Remove rows without enough data
The rolling function we used to calculate the Donchian Channels creates NaN values for the first 20 rows of the data, because there isn’t enough data to calculate the channels for these rows. We’ll use the dropna function to remove these rows.
# Drop the first 20 rows which contain NaN values due to the rolling window calculation
data = data.dropna()Step 6: Create a DataFrame for the channel
Next, we’ll create a new pandas DataFrame to hold the Donchian Channels. This will make it easier to plot the channels later.
# Create a new DataFrame for the Donchian Channels
dc = pd.DataFrame(index=data.index)
dc['UB'] = data['UB']
dc['MB'] = data['MB']
dc['LB'] = data['LB']Step 7: Plot the Donchian Channel
Now we’re ready to create the plot. We’ll use the mplfinance library to create a candlestick chart of the Gold price, and add the Donchian Channels as additional plots. We’ll also add a title and a label for the y-axis.
# Create a list of plots to be added
add_plots = [mpf.make_addplot(dc['UB'], color='g', linestyle='dashed'),
             mpf.make_addplot(dc['MB'], color='b', linestyle='dashed'),
             mpf.make_addplot(dc['LB'], color='r', linestyle='dashed')]

# Create a new figure and axes
fig, axes = mpf.plot(data, type='candle', style='yahoo', title='Gold Price with Donchian Channels',
                     ylabel='Price ($)', addplot=add_plots, figscale=1.25, figratio=(10, 7),
tight_layout=True, returnfig=True)Step 8: Add a legend
To make the chart easier to read, we’ll add a legend that explains what each line represents.
# Create custom legend
legend_lines = [plt.Line2D([0], [0], color='g', lw=2, linestyle='dashed'),
                plt.Line2D([0], [0], color='b', lw=2, linestyle='dashed'),
                plt.Line2D([0], [0], color='r', lw=2, linestyle='dashed')]

axes[0].legend(legend_lines, ['UB', 'MB', 'LB'], loc='upper left')Step 9: Show the chart
Finally, we’ll use the show function from matplotlib to display the plot.
# Show the plot
plt.show()Step 10: Run the code
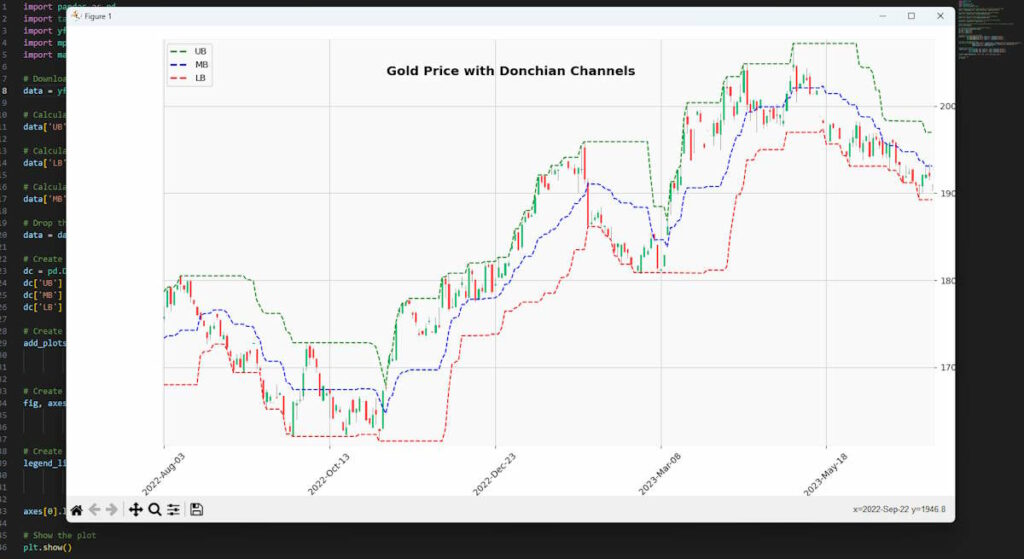
Save your Python file, then run it by right-clicking in the file and choosing “Run Python File in Terminal”. You should see a chart of the Gold price with Donchian Channels.
If all has gone to plan you will end up with a chart looking like mine shown below:
Step 11: Exclude the current candle so breakouts are visible
If you want the channel to be plotted one period late (i.e., excluding the current period), the reasons for which are discussed earlier in this post in the Purpose and Design of the Donchian Channel section, you can adjust the code as follows:
# Calculate the upper band (highest high over the last 20 days, excluding the current day)
data['UB'] = data['High'].shift(1).rolling(window=20).max()

# Calculate the lower band (lowest low over the last 20 days, excluding the current day)
data['LB'] = data['Low'].shift(1).rolling(window=20).min()

# Calculate the middle band (average of the upper and lower band)
data['MB'] = (data['UB'] + data['LB']) / 2
The shift(1) adjustment means today’s channel is calculated from previous candles only. In other words, today’s price is compared with the high and low from the prior 20 periods, not with a channel that already includes today’s candle.
This is useful because, without the shift, a breakout candle can become part of the channel itself. On the chart, that can make the breakout look as if it merely touched the band rather than moved beyond it.
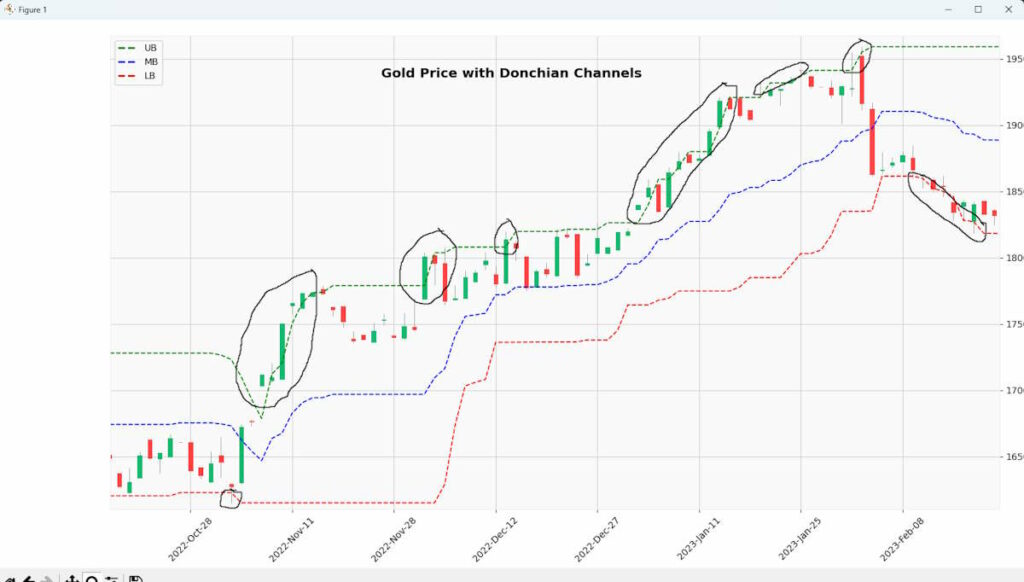
After making this change and zooming in, the breakout points become much easier to see. This is also closer to how many traders would think about the signal in practice: today’s close is being compared with the previous 20-period range.
This distinction matters if you are building a Donchian screener or testing a breakout strategy. A chart that includes the current candle in the channel can look cleaner, but it may hide the exact breakout event you are trying to detect.
If you are comparing your Python chart with charting platforms such as Yahoo Finance, check whether their Donchian Channel includes or excludes the current candle. Two charts can use the same 20-period setting but show slightly different breakout behaviour because of this calculation choice.
The Best Donchian Channel Strategy
There is no single “best” Donchian Channel strategy for every market. The indicator is simple: it shows the highest high and lowest low over a chosen period. The strategy comes from how you use those levels.
The most common Donchian Channel strategy is a breakout strategy. A trader looks for price to move above the upper channel, suggesting upside momentum, or below the lower channel, suggesting downside momentum. This is why the Donchian Channel is often associated with trend-following systems.
A simple version works like this:
- Use a 20-period Donchian Channel.
- Calculate the upper and lower channel from previous candles only.
- A close above the upper channel is treated as a bullish breakout.
- A close below the lower channel is treated as a bearish breakout.
- Use the opposite channel, the middle line, or a fixed risk level as an exit.
- Avoid taking every signal blindly in choppy, sideways markets.
The important word is close. Some traders use an intraday move above the channel as a breakout, but that can create more false signals. Waiting for the candle to close beyond the channel is slower, but it can reduce noise.
For example, if a stock has not traded above $50 during the last 20 sessions, and today it closes at $51, a Donchian breakout trader may treat that as a sign that buyers have pushed the market into new short-term territory. The trade is not guaranteed to work, but the signal is clear and testable.
False breakouts are the main weakness. Price can briefly move outside the channel and then reverse. For that reason, many traders combine Donchian Channels with another filter, such as:
- a longer-term moving average to trade only in the direction of the broader trend;
- volume confirmation to avoid weak breakouts;
- ATR-based stops to adjust for market volatility;
- avoiding trades when the channel is very narrow and the market is directionless.
A more cautious long-only version would be:
Buy only when price closes above the previous 20-period high and price is above the 200-period moving average. Exit if price closes below the 20-period low or if a predefined risk limit is hit.
That is not a magic formula, but it is a much better starting point than simply buying every touch of the upper band. It gives the strategy a clear entry rule, a trend filter, and an exit plan.
For backtesting, the channel should usually be shifted back by one candle. That means today’s breakout is judged against the highest high and lowest low from the previous 20 candles, not a channel that already includes today’s price. Without that adjustment, the chart can hide breakouts and the test may not reflect what a trader would have known at the time.
Conclusion
The Donchian Channel is simple, but the calculation detail matters. At its core, it marks the highest high and lowest low over a chosen lookback period. Traders then use those levels to identify breakouts, trail exits, or judge whether volatility is expanding or contracting.
The main practical point from this guide is that not every Donchian Channel chart is plotted the same way. If the current candle is included, historical breakouts can appear to disappear into the channel. If the channel is based on previous candles only, the breakout is easier to see and easier to test.
That distinction is especially important if you are coding your own indicator, building a screener, or backtesting a Donchian breakout strategy. The indicator is not a complete trading system by itself, but it can be a useful building block when combined with clear entry rules, exits, position sizing, and a sensible filter for choppy markets.
Frequently Asked Questions
- What is the Donchian Channel? The Donchian Channel is a trend-following indicator developed by Richard Donchian. It consists of an upper band, a lower band, and often a middle band, which is the average of the upper and lower bands.
- How is the Donchian Channel calculated? The upper band of the Donchian Channel is the highest high over a set number of periods, and the lower band is the lowest low over the same number of periods. The middle band is the average of the upper and lower bands.
- How do you use the Donchian Channel in trading? The Donchian Channel can be used to identify potential price breakouts and assess market volatility. A price breakout above the upper band may indicate a buying opportunity, while a breakout below the lower band may suggest a selling opportunity.
- What are the pros and cons of using the Donchian Channel? The Donchian Channel is simple to understand, versatile, and excellent at identifying potential price breakouts and assessing market volatility. However, it can be sensitive to price noise, requires confirmation from other indicators, provides limited information, and its effectiveness can depend on the choice of parameters.
- Should a Donchian Channel include the current candle? It depends on the purpose. For visual charting, some platforms include the current candle in the channel. For breakout rules and backtests, many traders prefer to exclude the current candle so today’s price is compared with the previous range.
- What is the best Donchian Channel setting? The classic setting is 20 periods, but there is no universal best setting. Shorter settings react faster but create more noise. Longer settings produce fewer signals and may suit slower trend-following approaches.
- Why do Donchian Channel breakouts sometimes disappear on a chart? If the breakout candle is included in the channel calculation, the upper or lower band adjusts to include that candle. This can make the breakout look like a touch of the band rather than a move beyond it.
Recommended music while trading this indicator – “Little Donkey”
You may wish to look at Bollinger Bands too.


