
Updated May 2026: This Aroon Oscillator guide has been refreshed with clearer formula notes, CQG-style signal interpretation, code tweaks, and a more practical explanation of trend and consolidation signals.

Introduction
The Aroon Oscillator is a trend indicator designed to show whether price is trending up, trending down, or moving without a clear direction.
It is built from two lines: Aroon Up and Aroon Down. Aroon Up measures how recently the highest high occurred within the lookback period. Aroon Down measures how recently the lowest low occurred. The oscillator subtracts Aroon Down from Aroon Up, producing a line that moves between +100 and -100.
That makes it different from oscillators such as RSI or Stochastics, which are often used to look for overbought or oversold conditions. The Aroon Oscillator is more about trend timing: whether recent highs or recent lows are dominating.
This guide explains where the Aroon Oscillator came from, how it is calculated, how traders use it, where it can mislead you, and I later show you how to code and plot it in Python and R.
Key Takeaways
- The Aroon Oscillator is calculated as Aroon Up minus Aroon Down.
- It ranges from +100 to -100.
- Readings above +50 often suggest an uptrend; readings below -50 often suggest a downtrend.
- Readings around zero suggest that neither recent highs nor recent lows are clearly dominating, which can point to consolidation.
- Aroon measures time since the most recent high or low, not the size of the price move.
- Zero-line crosses and +50/-50 threshold signals can be useful, but they should not be treated as automatic buy or sell instructions.
- The Python and R examples later in this article show how to calculate and plot the oscillator from recent market data.
History and Origin of the Aroon Oscillator
The Aroon indicator was developed by Tushar Chande in the 1990s and introduced in Technical Analysis of Stocks & Commodities magazine in 1995. He also developed the IMI indicator.
The name comes from the Sanskrit word often translated as “dawn” or “early light”. The idea is that the indicator tries to reveal the early signs of a new trend, much like the first light appears before full daylight.
The Aroon study uses two lines: Aroon Up and Aroon Down. Aroon Up asks how recently the highest high occurred. Aroon Down asks how recently the lowest low occurred. The Aroon Oscillator then turns those two lines into one value by subtracting Aroon Down from Aroon Up.
That single oscillator line can help traders judge whether recent price action is dominated by new highs, new lows, or neither.
Mathematical Construction
The Aroon Oscillator starts with two values: Aroon Up and Aroon Down.
Aroon Up measures how recently the highest high occurred within the lookback window. Aroon Down measures how recently the lowest low occurred.
Using CQG-style notation:
AroonUp = 100 \times \frac{Period - Offset_{High}}{Period}which can also be written as:
Aroon Up = 100 × (Period – offset to highest high) / Period
AroonDown = 100 \times \frac{Period - Offset_{Low}}{Period}which can also be written as:
Aroon Down = 100 × (Period – offset to lowest low) / Period
The offset is the number of bars back from the current bar. If the highest high occurred on the current bar, the offset is 0 and Aroon Up is 100. If the highest high occurred at the far end of the lookback window, the value is lower.
The Aroon Oscillator is then:
AroonOscillator = AroonUp - AroonDown
The oscillator therefore ranges from +100 to -100.
Simply put:
A high positive value means recent highs are dominating.
A low negative value means recent lows are dominating.
A value around zero means neither side has clear control.
Purpose and Design
The Aroon Oscillator is designed to measure trend direction and trend strength by looking at time, not distance.
That distinction is important. Many indicators focus on how far price has moved. Aroon focuses on how recently price made a new high or low within the lookback period.
If the highest high happened recently and the lowest low happened further back, Aroon Up will be high, Aroon Down will be lower, and the oscillator will be positive. That supports the idea of an uptrend.
If the lowest low happened recently and the highest high happened further back, the oscillator will be negative. That supports the idea of a downtrend.
If both lines are similar, the oscillator tends to sit near zero. That can suggest consolidation, indecision, or a market that is not producing fresh directional extremes.
How Traders Use the Aroon Oscillator
The Aroon Oscillator is best used as a trend and consolidation filter, not as a standalone trading system.
A value above +50 suggests that recent highs are dominating recent lows. This can support a bullish trend view.
A value below -50 suggests that recent lows are dominating recent highs. This can support a bearish trend view.
A move through the zero line can show a shift in which side is dominant. A cross from negative to positive suggests Aroon Up has overtaken Aroon Down. A cross from positive to negative suggests the opposite.
Readings around zero can warn that the market is not trending cleanly. This can help traders avoid forcing trend-following trades in choppy conditions.
The warning is that Aroon does not measure how large the move is. A small new high can push Aroon Up higher even if the price move itself is not impressive. For that reason, traders should confirm Aroon signals with price structure, volume, volatility, or another indicator.
Pros and Cons of the Aroon Oscillator
Like any indicator, the Aroon Oscillator has useful features and weaknesses.
Pros
Trend direction: It gives a quick view of whether recent highs or recent lows are dominating.
Consolidation warning: Readings around zero can help identify markets that are not trending cleanly.
Simple interpretation: Positive values favour upside trend conditions, while negative values favour downside trend conditions.
Works across timeframes: The same logic can be applied to daily charts, intraday charts, futures, FX, stocks or indices.
Useful for screeners: Because the calculation is simple, it can be coded into a Python or R screener.
Cons
It measures time, not magnitude: Aroon looks at how recently highs or lows occurred, not how powerful the move was.
False signals in ranges: In choppy markets, the oscillator can cross back and forth without producing useful trend signals.
Lookback sensitivity: A 14-period Aroon and a 25-period Aroon can give different readings.
Late in some trends: The signal can arrive after part of the move has already happened.
Not a complete system: It still needs risk management, price context and confirmation.
Coding the Aroon Oscillator in Python and R
Coding the Aroon Oscillator is fairly simple once the logic is clear. The indicator asks two questions:
1. How recently did the highest high occur?
2. How recently did the lowest low occur?
Aroon Up rises when the highest high is recent. Aroon Down rises when the lowest low is recent. The oscillator is then calculated as:
Aroon Oscillator = Aroon Up – Aroon Down
The examples below follow the same logic used by charting platforms such as CQG: for a 14-period Aroon Oscillator, the high or low is located inside the latest 15 bars, giving offsets from 0 to 14.
import numpy as np
import pandas as pd
import yfinance as yf


def calculate_aroon_oscillator(data, period=14):
    """
    Calculate the Aroon Oscillator using a CQG-style Period + 1 window.

    Aroon Up = 100 * (Period - offset_to_highest_high) / Period
    Aroon Down = 100 * (Period - offset_to_lowest_low) / Period
    Aroon Oscillator = Aroon Up - Aroon Down
    """

    data = data.copy()
    window = period + 1

    # Position of the highest high / lowest low inside the rolling window.
    # In the rolling array, the newest bar is at position period.
    high_position = data["High"].rolling(window).apply(np.argmax, raw=True)
    low_position = data["Low"].rolling(window).apply(np.argmin, raw=True)

    # Convert position inside the window into offset from the current bar.
    offset_high = period - high_position
    offset_low = period - low_position

    data["Aroon Up"] = 100 * (period - offset_high) / period
    data["Aroon Down"] = 100 * (period - offset_low) / period
    data["Aroon Oscillator"] = data["Aroon Up"] - data["Aroon Down"]
    data["Zero Line"] = 0

    return data


# Example data
ticker = "NFLX"
data = yf.download(
    ticker,
    start="2024-01-01",
    auto_adjust=False,
    progress=False
)

# yfinance can sometimes return MultiIndex columns, so flatten them if needed.
if isinstance(data.columns, pd.MultiIndex):
    data.columns = data.columns.get_level_values(0)

data = data.dropna()

period = 14
data = calculate_aroon_oscillator(data, period=period)The key detail is the offset. If the highest high occurred on the current bar, the offset is 0 and Aroon Up is 100. If the highest high occurred 14 bars ago in a 14-period study, Aroon Up is 0.
The same logic applies to Aroon Down, but using the most recent lowest low. The oscillator is then Aroon Up minus Aroon Down. Positive readings mean recent highs are dominating. Negative readings mean recent lows are dominating.
Using R instead of Python, the same calculation can be handled with the TTR package. The important point is still the same: the oscillator should be Aroon Up minus Aroon Down.
# Install packages if needed
# install.packages(c("quantmod", "TTR"))

library(quantmod)
library(TTR)

# Fetch data
data <- getSymbols(
  "NFLX",
  src = "yahoo",
  from = "2024-01-01",
  auto.assign = FALSE
)

period <- 14

# Calculate Aroon Up and Aroon Down
aroon_values <- Aroon(HLC(data), n = period)

# Check column names if your TTR version labels them differently
print(colnames(aroon_values))

# Aroon Oscillator = Aroon Up - Aroon Down
data$Aroon_Oscillator <- aroon_values[, "aroonUp"] - aroon_values[, "aroonDn"]

head(data)
The R example uses quantmod to download data and TTR to calculate the Aroon values. The Aroon Oscillator is then calculated as Aroon Up minus Aroon Down.
If your version of TTR uses slightly different column names, run colnames(aroon_values) and adjust the two column names in the final calculation.
Plotting the Aroon Oscillator on a Chart with Python
Now let’s plot the Aroon Oscillator under a candlestick chart. The example uses Netflix data, but you can replace NFLX with another Yahoo Finance ticker.
This chart includes price, volume, the Aroon Oscillator and a zero line. A move above zero means Aroon Up is stronger than Aroon Down. A move below zero means Aroon Down is stronger than Aroon Up.
python -m pip install yfinance pandas numpy mplfinance matplotlibThen follow the steps below and past each piece of code consecutively into your aroon_osc.py file not forgetting to save it at the end.
Section 1: Importing Libraries
import numpy as np
import pandas as pd
import yfinance as yf
import mplfinance as mpf
import matplotlib.pyplot as plt
from matplotlib.lines import Line2DThis imports the libraries used in the chart:
- yfinance downloads the market data.
- pandas handles the data table.
- numpy is used for the rolling high/low position calculations.
- mplfinance creates the candlestick chart.
- matplotlib is used for the legend and final plot display.
Section 2: Defining the Aroon Oscillator Calculation Function
def calculate_aroon_oscillator(data, period=14):
    """
    Calculate the Aroon Oscillator using a CQG-style Period + 1 window.
    """

    data = data.copy()
    window = period + 1

    high_position = data["High"].rolling(window).apply(np.argmax, raw=True)
    low_position = data["Low"].rolling(window).apply(np.argmin, raw=True)

    offset_high = period - high_position
    offset_low = period - low_position

    data["Aroon Up"] = 100 * (period - offset_high) / period
    data["Aroon Down"] = 100 * (period - offset_low) / period
    data["Aroon Oscillator"] = data["Aroon Up"] - data["Aroon Down"]
    data["Zero Line"] = 0

    return data
This function finds the position of the highest high and lowest low inside the latest Period + 1 bars. It then converts those positions into offsets from the current bar.
If the highest high is on the current bar, Aroon Up is 100. If the lowest low is on the current bar, Aroon Down is 100.
The oscillator is calculated as Aroon Up minus Aroon Down.
Section 3: Fetching Data and Calculating the Aroon Oscillator
# Fetch the data
ticker = "NFLX"

data = yf.download(
    ticker,
    start="2024-01-01",
    auto_adjust=False,
    progress=False
)

# yfinance can sometimes return MultiIndex columns, so flatten them if needed.
if isinstance(data.columns, pd.MultiIndex):
    data.columns = data.columns.get_level_values(0)

data = data.dropna()

# Define the period
period = 14

# Calculate Aroon Oscillator
data = calculate_aroon_oscillator(data, period=period)This downloads recent Netflix data from Yahoo Finance, cleans the data, sets a 14-period lookback, and calculates the Aroon Oscillator.
You can replace NFLX with another Yahoo Finance ticker if you want to test another stock, ETF or futures-style symbol.
Section 4: Preparing the Plot and Panel Sizes
# Define the additional plots
add_plots = [
    mpf.make_addplot(
        data["Aroon Oscillator"],
        panel=2,
        color="b",
        secondary_y=False,
        ylabel="Aroon Oscillator"
    ),
    mpf.make_addplot(
        data["Zero Line"],
        panel=2,
        color="black",
        secondary_y=False,
        linestyle="dashed"
    )
]

# Main chart panel, volume panel, oscillator panel
panel_sizes = (5, 1.5, 3)This prepares the Aroon Oscillator line and the zero line as additional plots below the candlestick chart. The panel sizes control how much space is given to the price chart, volume bars and oscillator panel.
Section 5: Creating the Plot, Adding Legends and Displaying the Plot
# Create the chart
fig, axes = mpf.plot(
    data,
    type="candle",
    style="yahoo",
    addplot=add_plots,
    volume=True,
    volume_panel=1,
    panel_ratios=panel_sizes,
    title=f"{ticker} and Aroon Oscillator",
    figratio=(12, 8),
    figscale=1.1,
    returnfig=True
)

# Create legend
legend_lines = [
    Line2D([0], [0], color="b", lw=1.5, linestyle="solid"),
    Line2D([0], [0], color="black", lw=1.5, linestyle="dashed")
]

axes[2].legend(
    legend_lines,
    ["Aroon Oscillator", "Zero Line"],
    loc="lower left"
)

# Show the plot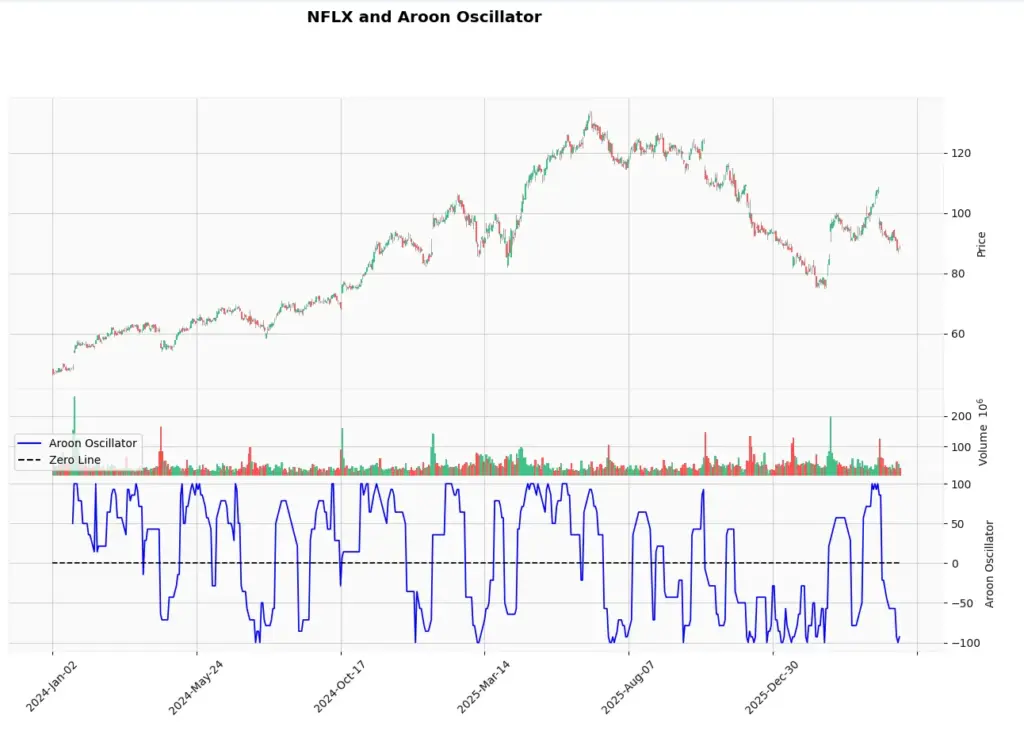
plt.show()This creates the candlestick chart, adds volume, plots the Aroon Oscillator in a lower panel, and adds a dashed zero line.
A positive oscillator means Aroon Up is stronger than Aroon Down. A negative oscillator means Aroon Down is stronger than Aroon Up. Readings near zero suggest that neither recent highs nor recent lows are clearly dominating.
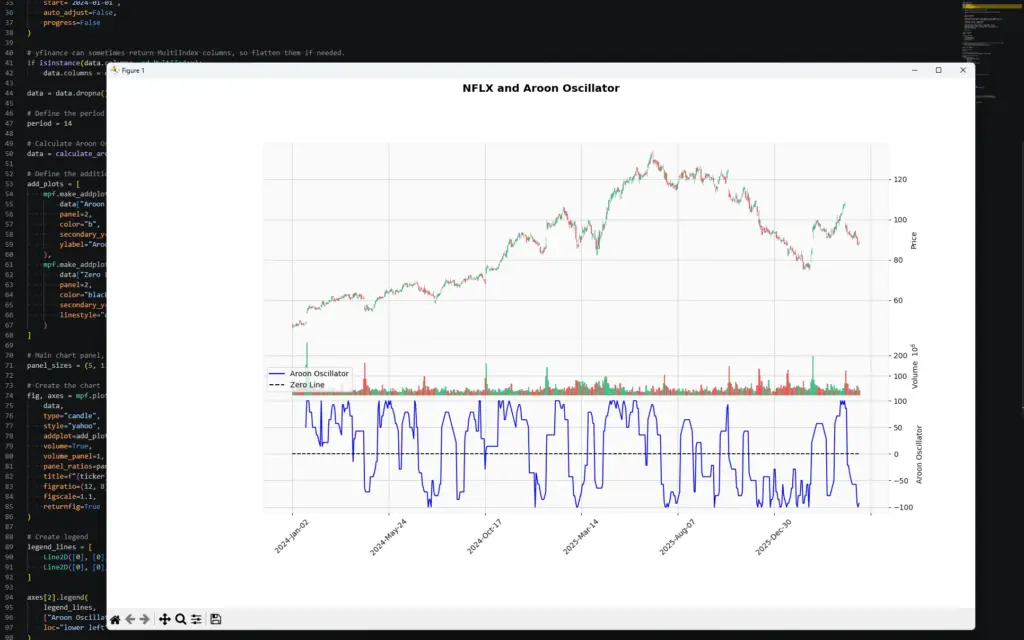
Save the file once you have added the above Python blocks of code into it and hit the play icon in the top right of VSCode to run the file. You will then end up with a chart looking like mine as shown below:
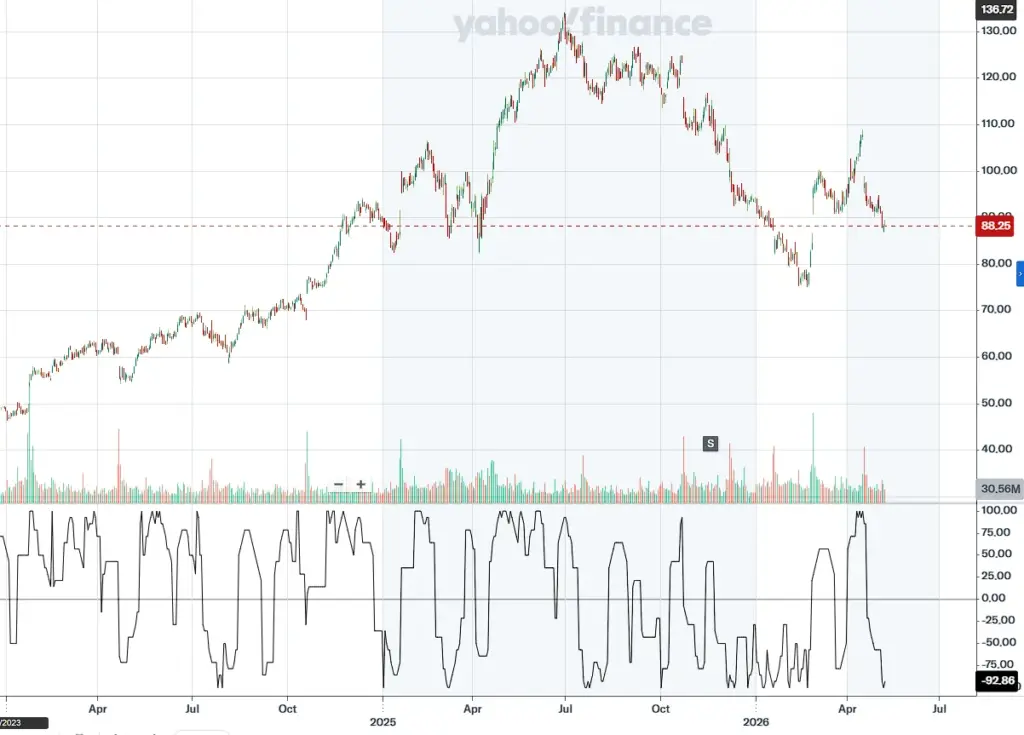
The result can be compared with charting platforms such as Yahoo Finance, CQG or TradingView, but small differences can occur depending on how the platform handles the lookback window, the current bar and missing data. In this example we use the Period + 1 approach described above, then calculate the oscillator as Aroon Up minus Aroon Down.
Comparison with Other Indicators
The Aroon Oscillator is most useful when you want to know whether recent highs or recent lows are dominating. That makes it different from many other popular indicators.
RSI: The Relative Strength Index is mainly used to judge momentum and stretched conditions. Traders often use RSI to look for overbought, oversold or divergence signals. The Aroon Oscillator is different because it focuses on time since the most recent high or low, not the size of recent gains or losses.
MACD: MACD is a trend-following momentum indicator built from moving averages. It is useful for judging changes in trend momentum. The Aroon Oscillator can also help identify trend shifts, but it does so by asking whether highs or lows are occurring more recently.
Bollinger Bands: Bollinger Bands are built around volatility. They can help show when price is stretched relative to a moving average, or when volatility is expanding or contracting. The Aroon Oscillator does not measure volatility directly. It can, however, help show whether a breakout is being supported by recent highs or recent lows.
Moving averages: A moving average smooths price to show trend direction. The Aroon Oscillator is more timing-focused: it asks how long it has been since the market made a high or low within the lookback window.
The important point is that each indicator should have a job. Aroon can help identify trend direction and consolidation. RSI can help judge momentum. Bollinger Bands can help with volatility. Moving averages can help define broader trend. Stacking indicators only helps if each one adds different information.
Frequently Asked Questions
What does a value of 0 in the Aroon Oscillator mean?
A value near 0 means Aroon Up and Aroon Down are close together. In practical terms, recent highs and recent lows are not clearly dominating each other. This can suggest consolidation, indecision or a market without a clean trend.
What does a positive Aroon Oscillator mean?
A positive reading means Aroon Up is greater than Aroon Down. Recent highs are occurring more recently than recent lows, which can support a bullish trend view.
What does a negative Aroon Oscillator mean?
A negative reading means Aroon Down is greater than Aroon Up. Recent lows are occurring more recently than recent highs, which can support a bearish trend view.
What do +50 and -50 mean on the Aroon Oscillator?
Readings above +50 are often treated as evidence of stronger upside trend conditions. Readings below -50 are often treated as evidence of stronger downside trend conditions. Values between +50 and -50 are less decisive and may point to consolidation or a weaker trend.
Is the Aroon Oscillator a buy or sell signal?
Not by itself. A move above zero, or above +50, can support a bullish view, while a move below zero, or below -50, can support a bearish view. But those signals should be checked against price structure, volume, volatility, support and resistance, and the broader market context.
Can the Aroon Oscillator be used for day trading?
Yes, but the lookback period matters. Shorter settings react faster but can produce more false signals. Longer settings are slower but may filter some noise. The Aroon Oscillator can be used on intraday charts, but it should still be tested on the market and timeframe being traded.
What is the best Aroon Oscillator setting?
There is no universal best setting. A 14-period setting is common, but different markets and timeframes may behave better with different lookbacks. The key is to test the setting rather than assume one default works everywhere.
Why can Aroon signals fail?
The Aroon Oscillator measures how recently highs or lows occurred. It does not measure the size of the move, volume behind the move, or whether a breakout has genuine follow-through. That is why it can give false signals in choppy or range-bound markets.
Further Reading
- Tushar S. Chande “The New Technical Trader: Boost Your Profit by Plugging into the Latest Indicators” (Wiley Finance) 1994
- Tushar S. Chande “Beyond Technical Analysis: How to Develop and Implement a Winning Trading System” (Wiley Trading), 2nd Edition 2007


