Investors often passionately align themselves into distinct camps: the gold bugs who swear by precious metals, stock market enthusiasts who rely on dividends and capital growth, and those convinced that property is the ultimate safe haven. But who’s truly been right over the last 25 years? While equity investors point to dividends and yields when challenged about lacklustre stock price movements, property fans tout surging house prices as undeniable evidence of success. Gold advocates highlight the metal’s impressive gains, especially as its price recently touched a record $3,000 per ounce—prompting renewed debates about “non-yielding” assets. This article seeks to finally settle the score but timing also matters enormously so we compare 20 and 25 year time horizons.
The surprising shift in how much gold it takes today compared to 20 years ago to buy a UK home might genuinely astonish readers and reshape the debate entirely.
Setting the Stage: Index Levels and Gold Prices (2000, 2005, and 2025)
UK Equities: FTSE 100’s Struggle and FTSE 250’s Triumph
FTSE 100 (UK-listed Blue Chips) – At the close of 1999, the FTSE 100 stood at 6,930.20 points, reflecting widespread market optimism. However, this optimism faded sharply leading to a low of around 3,600 low in March 2003, going on to close at 4,814.30 by the end of 2004. Two decades later, as of March 14, 2025, the FTSE 100 had rebounded to 8,632.33 points, delivering a nominal increase of roughly 24.5% over 25 years (6,930 to 8,632), pretty pathetic. However, with dividends reinvested, total returns significantly outpace the index’s modest price appreciation. According to Schroders, a £1,000 investment made at the end of 1999 grew to around £2,222 by 2019—a total return of about 122%, equating to a 4% annualized return. By 2025, the FTSE 100 Total Return Index would likely be around 2.5–3× its 2000 level, significantly outpacing the flat price-only performance.
FTSE 250 (UK Mid-Caps) – The mid-cap FTSE 250 entered 2000 at ~6,445 points, closing 2004 slightly higher at 6,936.80. The significant growth, however, occurred in the following decades, with the index reaching 19,995.59 by Mar 14, 2025—an impressive increase of over 210%. This remarkable growth was driven by robust domestic economic performance, which particularly benefited mid-sized UK companies. Although dividend yields on mid-cap stocks generally trail those of their larger counterparts in the FTSE 100, the combined impact of dividends and capital appreciation would be higher still.
Eurozone Disappointment: Euro Stoxx 50’s Lost Decades
Euro Stoxx 50 (Eurozone) – The Euro Stoxx 50 index peaked at 4,904.46 at the close of 1999 but was severely impacted by the dot-com crash, falling to 2,951 by the end of 2004. By March 14, 2025, it had recovered to around 5,404.18, marking a paltry increase of about 10% in nominal terms over 25 years, barely above its 1999 high. With dividends reinvested (Euro Stoxx 50 Total Return), the performance improves – but even then the eurozone’s equity returns have lagged.
Germany’s Dividend Advantage: Why the DAX Stands Out
DAX (Germany) – The DAX 40 index (previously 30), which is a total-return index incorporating dividends into its price, ended 1999 at 6,958, falling to 4,256.08 by the end of 2004. By March 14, 2025, the DAX stood at 22,986.82, reflecting impressive total returns of approximately 230%. This robust performance contrasts sharply with the Euro Stoxx 50’s price-only returns, underscoring dividends as a key factor in long-term investment performance in European markets. It is doing particularly well so far in 2025 due to the proposed spending increases on defence by the incoming government already up 9.16% YTD.
U.S. Markets: Momentum of S&P 500, Dow, and Nasdaq
S&P 500 (USA) – The S&P 500 ended 1999 at 1,469.25 points, subsequently dipping to ~1,211.9 by end-2004 after the early-2000s bear market but recovering strongly to reach 5,638.94 points by March 14, 2025—a nominal rise of approximately 284% since 2000. Including dividends, returns are even more dramatic. An initial $100 invested in 2000 would have grown to roughly $666 by 2025, a total return of about 566%, 7.85% annually or 6.66 times the original investment, significantly outpacing the price-only growth over 25 years.
Dow Jones Industrial Average (USA) – The Dow closed 1999 at 11,497.12 points and 10,783.01 at end-2004 but since reached about 41,488.19 by March 14, 2025, marking a price-only increase of roughly 261% since 2000. Although dividends aren’t factored into the index itself, adding an approximate annual dividend yield of about 2% would further enhance these already substantial returns.
Nasdaq (USA) – The Nasdaq, heavily weighted toward technology stocks, closed 1999 at 4,069.31 but experienced a sharp decline following the dot-com crash, ending 2004 at 2,175.44. Driven by a resurgence in technology, the Nasdaq surged to 17,754.09 by March 2025, an impressive increase of about 336% vs the year 2000 level (+716% since the 2004 close). (Note: Nasdaq’s returns are price-only; many tech stocks reinvest profits into growth rather than pay high dividends, so total return and price return are closer for Nasdaq.)
Gold’s Golden Era: A 25-Year Surge in Prices Across Currencies
Gold Prices – Gold was trading around $279–$290 per ounce at the start of 2000 (1999 close $290.85). By January 2005, gold was about $438 per oz. As of March 14, 2025, gold is approximately $2,985/oz (it briefly touched a record $3,000 intraday. In USD terms, gold’s nominal price has risen roughly 10.3× since 2000 (from ~$288 to ~$2,985, ~+937%). In GBP terms the increase was even larger due to pound depreciation: in Jan 2000 gold was ~£175/oz (at ~$279 and £1 ≈ $1.60) and now ~£2,313/oz (at ~$2,985 and £1 ≈ $1.29), a gain of about 13–14× (+1,200%). In EUR, gold rose from ~€280 to ~€2,740 (~9.8×, +880%).
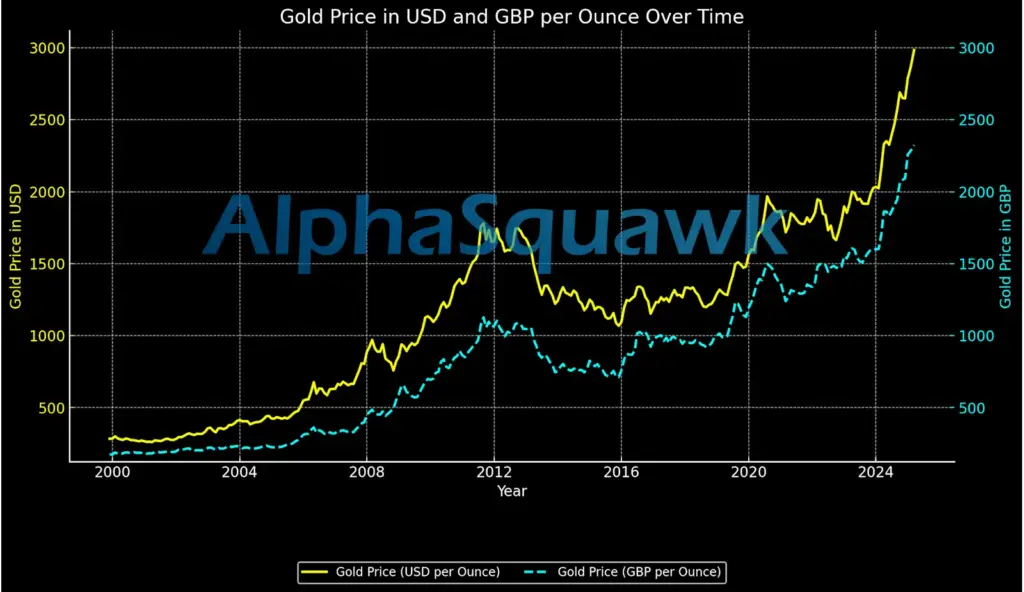
Bottom line: gold dramatically outperformed stock indices in absolute price growth over 25 years, albeit with no dividends.
Nominal Growth: Stocks vs Gold
Over the 25-year period (2000–2025), gold has vastly outpaced major stock indices in price appreciation. Gold’s roughly +900–1,200% surge (depending on currency) dwarfs the price-only gains of the S&P 500 (+284%), FTSE 100 (+24%), Euro Stoxx 50 (+10%), etc. However, when considering total returns (with dividends), U.S. equities catch up considerably. For instance, the S&P 500’s +566% total return isn’t massively behind gold’s +937% (in USD). In contrast, UK and European equities, even with dividends, remained well behind gold’s growth. The FTSE 100’s roughly ~2.5× total return (estimated ~150%–170% gain) falls short of gold in GBP (~13×). The Euro Stoxx 50’s total return (estimated ~+80–100% since 2000) also lags gold in EUR (~10×).
Timing is Everything: Comparing 2000 and 2005 Starting Points
Over the 20-year period (2005–2025), the comparison shifts slightly. Starting in 2005 (after the dot-com bust means stocks began from a lower base), equity indices show stronger relative gains. From Jan 2005 to Mar 2025, the S&P 500 price index rose about +365% (1,211 to 5,639), and with dividends the total return is higher (~+510%). The FTSE 100 price index from 2005 to 2025 gained a modest ~53% (4,814 to 7,733 at end-2023; 2025 ~8,632), but including dividends it roughly doubled. Euro Stoxx 50 is up ~83% in price (2,951 to ~5,404), still underperforming U.S. stocks. Gold, from ~$438 in Jan 2005 to ~$2,985 in 2025, rose ~+581% in USD. Thus, even from 2005, gold’s ~$US performance edges out the S&P 500’s price return, but is closer to parity with S&P’s total return. In GBP and EUR terms, gold’s 20-year gains remain far ahead of local equity indexes’ performance.
Key insight: The dot-com crash starting point (2000 vs 2005) makes a big difference for stock returns. 2000 was a peak – a UK investor who bought FTSE in Jan 2000 saw almost no price growth 25 years later, whereas buying in 2005 (post-crash) roughly doubled their money by 2025 in price terms. U.S. stocks similarly needed about 5–7 years after 2000 to fully recover; from the 2003–2005 trough they compounded strongly. Gold, on the other hand, began 2000 near multi-decade lows and had a largely unbroken upward run, especially during the 2000s and early 2020s, giving it a big advantage over the full 25-year span.
Reality Check: Inflation-Adjusted (“Real”) Returns (2000-2025)
Inflation has eroded the purchasing power of all currencies over the last 20–25 years. In the U.S., consumer prices roughly doubled from 2000 to early 2025 (about +84% cumulative CPI inflation). The UK saw similar inflation (around 86% increase in CPI over 25 years), and the euro-area just slightly less (around 72% increase, as the ECB era averaged ~2% inflation). This means that a 100% nominal gain since 2000 equates to a real gain of only ~8.7% in the U.S., ~7.5% in the UK, and ~16.3% in the euro-area.
- Gold: Even after inflation, gold’s gains are outstanding. In real terms, gold’s price in 2025 is about 5×–7× its 2000 level (depending on currency). For example, in USD gold rose roughly 937% nominally—that is, about a 10.37× increase. Adjusting for 84% US inflation (a 1.84× increase), this translates to a real multiplier of about 10.37⁄1.84 ≈ 5.63 (i.e. roughly a 463% real increase, or about 5.6× its original purchasing power). In GBP, gold’s approximately 1,200% nominal rise (a 13× multiplier) versus 86% UK inflation (a 1.86× factor) yields a real multiplier of about 13⁄1.86 ≈ 7.0—that is, roughly 600% real growth. Clearly, gold was an excellent store of value over this period, far outpacing inflation.
- U.S. Stocks: The S&P 500’s 284% nominal price gain (a multiplier of about 3.84) shrinks to roughly 3.84⁄1.84 ≈ 2.09× its year-2000 level—a real gain of about 109%—after 84% inflation. However, when including dividends (which pushed nominal total returns to roughly 566%, or a 6.66× multiplier), the S&P 500 delivered around 6.66⁄1.84 ≈ 3.62× growth in real terms (about a 262% increase). That works out to an annualized real return of roughly 5.5%, in line with long-run equity averages. The Dow’s price-only increase since 2000 is about 261%—that is, the index multiplied by roughly 3.61. After adjusting for 84% cumulative U.S. inflation (a 1.84× increase in general prices), this equates to a real multiplier of about 3.61⁄1.84 ≈ 1.96—meaning the Dow’s real value nearly doubled (a 96% real gain) over the period. Although dividends aren’t factored into the index, adding an approximate annual dividend yield of around 2% would further boost the total return. Meanwhile, the Nasdaq’s huge nominal run of 336% (a multiplier of about 4.36) translates to roughly 4.36⁄1.84 ≈ 2.37× its original level—a real gain of about 137%—reflecting both an early crash and the massive subsequent tech boom.
- UK Stocks: The FTSE 100’s price performance barely kept pace with inflation. A UK investor holding the FTSE 100 from 2000 to 2025 saw only around 24% nominal growth. With UK inflation at 86% (a 1.86× factor), this modest nominal increase resulted in a significant real loss on price. Dividends, however, made a big difference. With reinvestment, the FTSE 100’s total return reached about 150% nominal (a 2.5× multiplier), which, after adjusting for inflation (2.5⁄1.86 ≈ 1.34×), translates to roughly a 34% real gain. In other words, after 25 years, the FTSE 100’s purchasing power grew by only about 34%—an annualized real return of roughly 1.3%. The FTSE 250 did better: its price increased by around 210% nominally (a 3.10× multiplier, which is about 3.10⁄1.86 ≈ 1.67× in real terms, or a 67% real gain). With dividends, its total returns likely exceeded 300% nominal (a 4.00× multiplier), which means 4.00⁄1.86 ≈ 2.15× the initial value—that is, roughly a 115% real increase—outperforming its large-cap counterpart thanks to stronger growth among mid-cap companies.
- Eurozone Stocks: The Euro Stoxx 50’s modest 10% nominal price rise (a 1.10× multiplier) falls short of keeping pace with 72% inflation (a 1.72× factor), resulting in a real value of only about 1.10⁄1.72 ≈ 0.64× the original—roughly a 36% real loss. Even including dividends (which might boost nominal returns to around 100%, i.e. a 2.0× multiplier), the Euro Stoxx 50’s total return would be about 2.0⁄1.72 ≈ 1.16× its starting level—a modest real gain of roughly 16%. In contrast, the DAX, with a nominal total return of around 230% (a 3.30× multiplier), comes out to roughly 3.30⁄1.72 ≈ 1.92× its 2000 level—nearly doubling purchasing power. This stark divergence underscores the importance of dividend reinvestment and national market composition—German equities (export‐heavy with high dividends) fared far better than the broader euro-area index.
In summary, U.S. equities and gold have delivered the strongest real growth since 2000. A US investor in the S&P 500 enjoyed substantial real wealth increase – and in gold even more so. UK equities struggled to beat inflation without dividends, and even with them only eked out modest real growth. Eurozone blue-chips essentially stagnated in real terms (again, excluding Germany’s DAX).
Currency Effects – How FX Shifts Boosted or Eroded International Returns (GBP, EUR vs USD)
Currency fluctuations significantly impacted cross-border investors and relative asset values:
- The British pound weakened sharply over 25 years. In January 2000, £1 was about $1.62. By early 2025, £1 bought only ~$1.25 (GBP/USD ~1.25). That is a ~23% decline in sterling’s USD value. Consequently, assets priced in USD gained an extra boost when translated to GBP. For example, the S&P 500’s +284% USD price growth is roughly +380% in GBP terms (plus dividends and FX, well over +600% in GBP). Gold’s rise in GBP was amplified (as noted, ~13× in GBP vs ~10× in USD). For a UK investor, owning U.S. stocks or gold provided not only local asset growth but also a currency gain as the dollar strengthened against the pound. On the flip side, U.S. investors in UK stocks saw the currency drag reduce their returns. The FTSE 100’s meagre performance in GBP, when translated to USD, was even worse due to the weaker pound.
- The euro initially strengthened from ~$1.00 in 2000 to about $1.35 by 2005 then settled around ~$1.09 by 2025. Net-net, the euro is slightly stronger vs USD now than in 2000 (~1.09 vs ~1.01). Thus, Eurozone assets didn’t get the same FX boost relative to USD; their underperformance is more a real weakness than a currency illusion. A euro-based investor in U.S. assets would have gained a bit from USD appreciation (and much more from the asset performance). Meanwhile, a U.S. investor in Euro Stoxx 50 not only suffered the index’s poor dollar returns, but saw little help from euro exchange rates (the euro’s value is roughly flat over the full period, with ups and downs in between).
- In GBP vs EUR: £1 was ~€1.63 in 2000, but only ~€1.19 by 2025 (implying about 27% depreciation of GBP against the euro). This means British investors in Eurozone assets saw a currency gain. For example, an investor in German DAX stocks got the strong DAX total returns plus the euro’s rise vs GBP. Conversely, Eurozone investors in UK assets saw the pound fall – a German investing in the FTSE 100 would have very poor returns from both the index and the FX loss.
Bottom line: Currency movements have favoured the U.S. dollar in this era (especially post-2008), benefiting USD-denominated investments for foreign holders. For UK investors, global diversification (in USD or EUR assets) boosted returns simply via a stronger foreign currency. This also means UK investors holding domestic assets missed out on that currency cushion – one reason UK stocks and bonds provided relatively low total returns in international comparison.
UK Housing as an Alternative Asset
According to Nationwide data, the average UK home price was about £75,000 in 1999. By December 2004 it had risen to approximately £152,623, and by February 2025 it reached around £270,493. This represents a nominal multiplier of about 3.61× from 1999 to 2025 (a +261% increase). When adjusted for inflation—using an estimated inflation multiplier of roughly 1.86 (reflecting around an 86% CPI increase over 25 years)—this equates to a real multiplier of about 3.61 ÷ 1.86 ≈ 1.94, meaning UK housing nearly doubled in real terms (a roughly 100% real gain) over 25 years.
This beats the FTSE 100 handily and even edges the FTSE 250. Importantly, it also outpaced inflation (≈80%), yielding roughly a 100% real growth in UK house prices over 25 years—nearly doubling purchasing power. Annualized, UK house prices grew about ~5.3% nominally per year. Adjusting for inflation, this translates to an approximate real annual growth rate of 2.8% (since doubling over 25 years implies about a 2.8% annual increase in real terms). That real growth rate is lower than the S&P 500’s real return but higher than UK equities’ real return.
For comparison, using the Bank of England’s inflation calculator for a shorter period shows that £100 in 2005 is equivalent to £173.35 in 2025 (a multiplier of 1.7335). If we approximate the 2005 housing price using the December 2004 figure of £152,623, then the nominal increase from 2005 to 2025 is 270,493 ÷ 152,623 ≈ 1.77× (+77.2%). Dividing this by the inflation multiplier of 1.7335 yields a real multiplier of about 1.02×—only a roughly 2% real gain over 20 years.
This contrast between 25 or 20 year look backs underscores the importance of the chosen baseline: over the full 25-year period (1999–2025) housing nearly doubled in real value, while starting in 2005 (post-crash) shows only minimal real growth relative to inflation.
Gold vs. House Price Comparison
Background:
In 2000, gold in the UK traded at roughly £175 per ounce, while the average UK house price was about £75,000. By February 2025, gold surged to around £2,400 per ounce, while the average UK house price reached approximately £270,493.
Calculations:
In 2000:
• House price: £75,000
• Gold price: £175/oz
• Gold required to “buy” the house:
£75,000 ÷ £175/oz ≈ 429 ounces
• In grams:
429 oz × 31.1 g/oz ≈ 13,340 grams (or ~13.3 kg)
In 2025:
• House price: £270,493
• Gold price: £2,400/oz
• Gold required to “buy” the house:
£270,493 ÷ £2,400/oz ≈ 113 ounces
• In grams:
113 oz × 31.1 g/oz ≈ 3,510 grams (or ~3.5 kg)
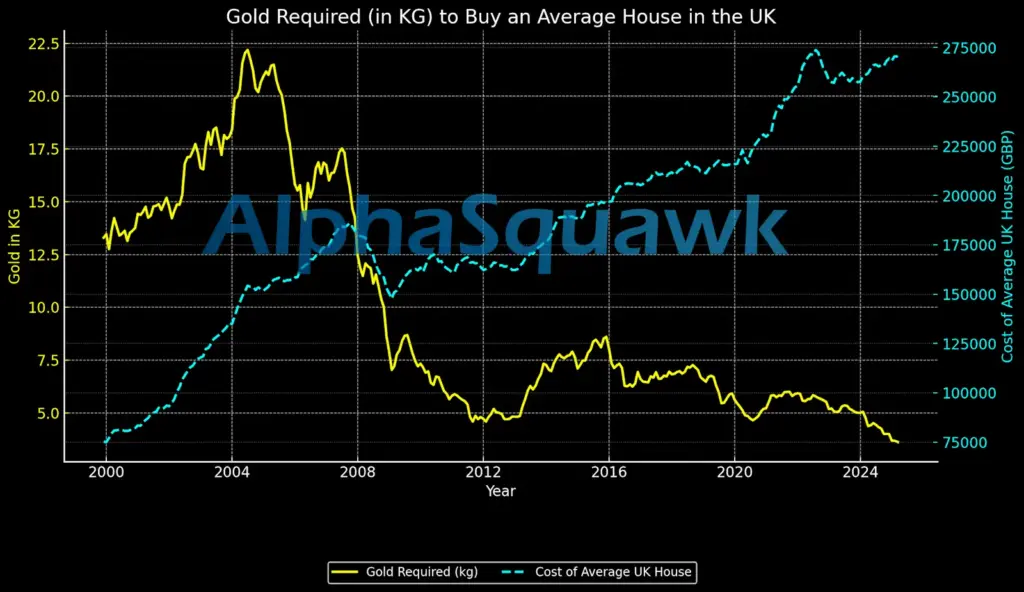
Interpretation:
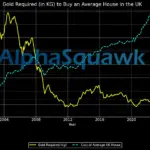
In 2000, you would have needed about 429 ounces or 13.3kg of gold to buy an average house. By 2025, you would need only about 110 ounces or 3.5kg to buy the average house. Although house prices increased in nominal terms by about 3.61× (from £75,000 to £270,493), gold’s GBP price climbed even more—roughly 13.7× (from £175/oz to £2,400/oz). Thus, the “gold cost” of a house decreased significantly over this period.
| Year | Gold Price (GBP/oz) | Average House Price (GBP) | Gold Required for house (oz/kg) |
|---|---|---|---|
| 2000 | £175 | £75,000 | 429 oz or 13.3kg |
| 2025 | £2,400 | £270,493 | 110 oz or 3.3kg |
While UK property roughly doubled in real value (a 100% increase), gold’s GBP price, when adjusted for the same 80% inflation over the period, surged by about 7.6×—a real gain of roughly 660%—demonstrating gold’s far superior performance in real terms.
Conclusion and Takeaways
Over the past 20–25 years, gold has been a standout asset, maintaining and multiplying real value across multiple currencies. Equities also delivered strong results – especially U.S. stocks – but one must factor in dividends to see their full impact. The S&P 500’s total return ultimately competed with gold’s performance in dollar terms and eclipsed most other assets, whereas European and UK stock indices lagged notably, even including dividends. In the UK, the underwhelming FTSE 100 performance has often been noted: as of 2017, it was still below its 1999 peak in price terms, prompting comments such as “FTSE 100 returned 94% without moving” when dividends are considered. By 2025, thanks to recent gains, the FTSE 100 did finally surpass its 1999 high, but most of its investor return came from dividends.
Inflation-adjusted, U.S. equities and gold have achieved the greatest growth since 2000, while UK equities barely broke even and Eurozone blue-chips basically stagnated in real terms (with Germany’s DAX being the notable exception due to its total-return construction). This highlights the value of reinvested income (dividends or rent) in long-term investing – price appreciation alone can be disappointing, especially if purchased at a peak (like in 2000). It also underscores the importance of diversification and currency: UK or Euro investors who diversified into U.S. assets benefited from stronger underlying gains plus a beneficial currency shift. Conversely, those with a home bias in UK or European markets saw far lower real returns.
Notably, UK housing delivered a robust 100% real gain over 25 years—effectively doubling in purchasing power—which, while solid compared to the underwhelming performance of domestic equities (e.g. the FTSE 100’s modest ~34% real gain), still pales in comparison to gold’s extraordinary real return of roughly 660%. Also if you consider UK property since 2005 instead it only equates to a 2% real gain whereas gold had a real gains of 485% since 2005. (In 2005, with GBP/USD around 1.92, gold was about £228 per ounce (i.e. $438 ÷ 1.92). By 2025, gold in GBP is around £2,313 per ounce. This gives a nominal multiplier of about 2,313 ÷ 228 ≈ 10.15×. Adjusting for the same 20‑year inflation multiplier (1.7335), gold’s real multiplier becomes 10.15 ÷ 1.7335 ≈ 5.85. In percentage terms, this is a cumulative real gain of about 485% over 20 years.)
Summary Table of 25-Year (2000-2025) Performance
Below is a table comparing the performance of various assets in their local currency (with separate rows for price-only and total return where data is available). All “Real Return” figures are calculated by dividing the nominal multiplier by the relevant inflation multiplier (1.86 for UK assets, 1.84 for U.S. assets, 1.72 for Eurozone assets, and 1.84 for USD gold as an approximation).
| Asset | Metric | Nominal Multiplier | Nominal Return (%) | Real Multiplier | Real Return (%) | Notes |
|---|---|---|---|---|---|---|
| FTSE 100 (UK) | Price-Only | ~1.25 | +24.5% | ~1.25 ÷ 1.86 ≈ 0.67 | –33% | Price-only performance; barely kept pace with 86% inflation |
| Total Return | ~2.50 | +150% | ~2.50 ÷ 1.86 ≈ 1.34 | +34% | With dividends reinvested | |
| FTSE 250 (UK) | Price-Only | ~3.10 | +210% | ~3.10 ÷ 1.86 ≈ 1.67 | +67% | |
| Total Return | ~4.00 | +300% | ~4.00 ÷ 1.86 ≈ 2.15 | +115% | ||
| Euro Stoxx 50 (Eurozone) | Price-Only | ~1.10 | +10% | ~1.10 ÷ 1.72 ≈ 0.64 | –36% | |
| Total Return | ~2.00 | +100% | ~2.00 ÷ 1.72 ≈ 1.16 | +16% | ||
| DAX (Germany Total Return) | Total Return | ~3.30 | +230% | ~3.30 ÷ 1.72 ≈ 1.92 | +92% | |
| S&P 500 (USA) | Price-Only | ~3.84 | +284% | ~3.84 ÷ 1.84 ≈ 2.09 | +109% | |
| Total Return | ~6.66 | +566% | ~6.66 ÷ 1.84 ≈ 3.62 | +262% | Dividends are a major driver | |
| Dow Jones Industrial Avg. (USA) | Price-Only | ~3.61 | +261% | ~3.61 ÷ 1.84 ≈ 1.96 | +96% | Dividends not factored in |
| Nasdaq (USA) | Price-Only | ~4.36 | +336% | ~4.36 ÷ 1.84 ≈ 2.37 | +137% | |
| Gold (USD) | Price-Only | ~10.37 | +937% | ~10.37 ÷ 1.84 ≈ 5.63 | +463% | |
| Gold (GBP) | Price-Only | ~13.00 | +1,200% | ~13.00 ÷ 1.86 ≈ 7.00 | +600% | FX boost: using corrected exchange (from £1.60 to £1.29) |
| Gold (EUR) | Price-Only | ~9.80 | +880% | ~9.80 ÷ 1.72 ≈ 5.70 | +470% | |
| UK Housing* | Price (Assumed) | ~3.61 | +261% | ~3.61 ÷ 1.80 ≈ 2.00 | +100% | Uses 80% inflation estimate for housing; nearly doubled in real terms |
*For the housing row, we used the published average monthly UK home prices—as reported by Nationwide—showing that the average price increased from about £75,000 in 1999 to roughly £270,493 in February 2025. This yields a nominal multiplier of about 3.61 (a 261% increase). While earlier we referenced an approximate 80% CPI inflation over the period, using the actual published housing data and UK CPI (roughly a 1.86× increase), the real multiplier for housing comes out to be about 2.00—indicating that, in real terms, UK housing roughly doubled (a 100% real gain).
20‑Year Snapshot: 2000–2025 vs. 2005-2025
| Asset | Metric | 2000–2025 Nominal Return | 2005–2025 Nominal Return | Difference | Notes |
|---|---|---|---|---|---|
| S&P 500 (USA) | Price‑Only | 3.84× (+284%) | 4.65× (+365%) | +0.81× / +81 percentage points | A lower starting base in 2005 boosts the price return. |
| Total Return | 6.66× (+566%) | 5.10× (+510%) | –1.56× / –56 percentage points | Dividends over the full 25-year period (including 2000–2005) add significantly relative to a 2005 entry. | |
| FTSE 100 (UK) | Price‑Only | 1.25× (+24.5%) | 1.53× (+53%) | +0.28× / +28.5 percentage points | Although a 2005 entry yields a higher price return (buying at depressed levels after the 2000 peak), overall gains remain modest. |
| Total Return | 2.50× (+150%) | 2.00× (+100%) | –0.50× / –50 percentage points | Dividend reinvestment over the full period lifts the 2000–2025 total return—even though the 2000 entry price was high. | |
| Euro Stoxx 50 (Eurozone) | Price‑Only | 1.10× (+10%) | 1.83× (+83%) | +0.73× / +73 percentage points | The post–dot-com recovery from 2005 is much stronger. |
| Total Return | 2.00× (+100%)* | 2.50× (+150%)* | +0.50× / +50 percentage points | *Estimated: With dividends reinvested, the 2005–2025 total return improves notably compared to the 2000 start. | |
| DAX (Germany Total Return) | Total Return | 3.30× (+230%) | 5.40× (+440%) | +2.10× / +210 percentage points | As a total return index, the DAX reflects strong post-2005 recovery relative to the 2000 start. |
| Gold (USD) | Price‑Only | 10.37× (+937%) | 6.82× (+581%) | –3.55× / –356 percentage points | A 2000 entry benefits from buying near multi‑decade lows; a 2005 start misses those early gains. |
| Gold (GBP) | Price‑Only | 13.00× (+1,200%) | 10.14× (+914%) | –2.86× / –286 percentage points | Using historical FX: In 2000, gold traded at ~£175/oz (with £1 ≈ $1.61); by 2005, with GBP/USD ≈1.92, gold was roughly £228/oz; and by 2025, at GBP/USD ≈1.29, gold reached ~£2,313/oz. |
| UK Housing | Price‑Only | ~3.61× (+261%) | ~1.77× (+77%) | –1.84× (–184 percentage points) | Based on published data: average price ~£75k in 1999/2000 rising to ~£270k in 2025 versus ~£152k in 2004/2005. The 2000–2025 period reflects a ~3.61× increase (≈+261% nominal) and—when adjusted for an 86% CPI rise (multiplier ~1.86)—a real multiplier of ~1.94 (i.e. nearly 100% real gain). In contrast, the 2005–2025 period yields only a 1.77× increase (≈+77% nominal), which, when adjusted for a Bank of England inflation multiplier of 1.7335, comes to roughly a 1.02× real gain (about +2% real). |
As with all “price vs. total return” comparisons, we haven’t gone deep into frictional costs: e.g. property taxes and upkeep for a house, gold storage costs, fund fees for equity investing, etc.
